 Chapter four
Chapter four
Using Performance Measures to Track and Demonstrate Progress
Performance-based planning and programming (PBPP) refers to transportation agencies’ application of performance management in their planning and programming to achieve desired outcomes for the multimodal transportation system. For MPOs, this embraces a range of activities and products together with other agencies, stakeholders, and the public as part of the 3C Metropolitan Transportation Planning Process. This includes developing:
The goal of PBPP is to ensure that transportation investment decisions—both long-term planning and short-term programming—are based on their ability to meet established goals.
The cornerstone of Moving Ahead for Progress in the 21st Century’s (MAP-21) highway program transformation is this movement to performance- and outcome-based results. The current transportation authorization legislation, the Fixing America’s Surface Transportation (FAST) Act, continues the performance-based planning and programming provisions established under MAP-21.
States will invest resources in projects to achieve individual state targets that collectively will make progress toward national goals, as detailed in the FAST Act:
The U.S. Secretary of Transportation, in consultation with states, MPOs, and other stakeholders, has: (1) established safety performance measures to carry out the Highway Safety Improvement Program and assess fatalities and serious injuries on all public roads; (2) proposed performance measures for Interstate and NHS pavement and bridge conditions, and general performance of the Interstate and NHS; and (3) proposed performance measures to assess traffic congestion and on-road mobile-source emissions.
States and MPOs will set performance targets to support these measures; and state and metropolitan plans will describe how program and project selection would help to achieve the targets.
TABLE 4-1 National and MPO Performance Goals
National Goal |
MPO Goal |
Safety |
Safety |
Infrastructure Condition, System Reliability |
System Preservation |
Congestion Reduction |
Capacity Management/Mobility |
Environmental Sustainability |
Clean Air/Clean Communities |
Freight Movement/ Economic Vitality |
Economic Vitality |
The Boston Region MPO’s transition to performance-based planning is underway in anticipation of FAST Act performance-measure requirements. The MPO has:
MPO goals provide the foundation for the TIP criteria used in the project selection process, as described in Chapter 2. These criteria describe the ways that individual projects are expected to help the MPO advance its various goals. Over time, the contributions made by TIP projects are expected to generate changes in the transportation system’s performance.
In Charting Progress to 2040, the MPO’s most recent LRTP, the MPO strengthened the link between its spending and improving transportation performance by establishing a series of investment programs. These programs each support multiple MPO goals, and include:
As part of developing the LRTP, the MPO allocated a large portion of its discretionary funds to these investment programs over the LRTP’s 25-year life span. In turn, these fund TIP projects that meet the investment program’s criteria. Detail about these programs and their relationship to MPO goals is shown in Figure 4-1 on the following page. Table 4-2, below, and Figure 4-2 show how FFYs 2017−2021 regional target funding is distributed across MPO investment programs.
TABLE 4-2 Projects and funding, by Investment program
Investment Program |
Number of Projects |
Funding for Projects |
Major Infrastructure |
9 |
$330.2 million |
Complete Streets |
14 |
$116.1 million |
Intersection Improvements |
3 |
$12.9 million |
Bicycle Network and Pedestrian Connections |
1 |
$2.6 million |
Community Transportation / Parking / Clean Air and Mobility |
1 |
$1.75 million |
Figure 4-1 MPO INVESTMENT PROGRAMS
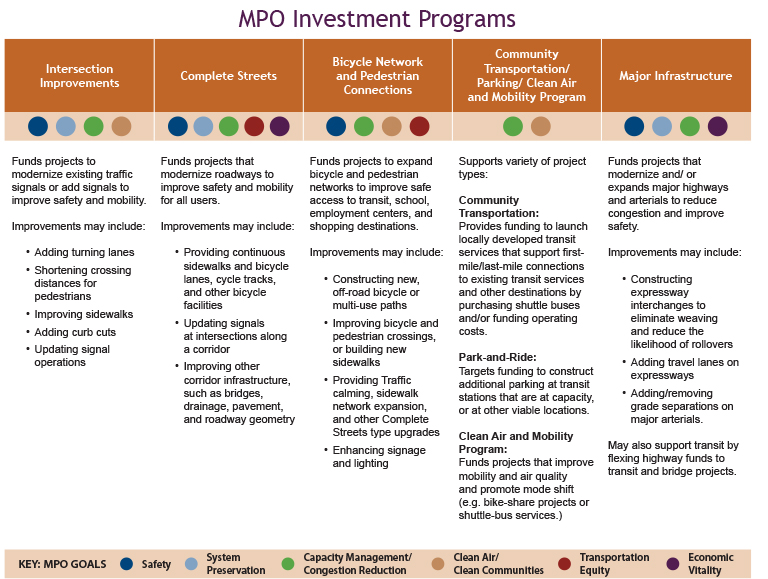
FIGURE 4-2 FFYs 2017−2021 TIP Regional MPO Target funding, by Investment program

The following sections of this chapter track performance measures and demonstrate how transportation investments for the next five years would advance the MPO’s goals and objectives.
Safety for all transportation modes continues to be a top priority for the MPO. MPO goals commit to investing in projects and programs that reduce the severity of crashes for all modes.
The MPO tracks traffic fatalities and serious injuries in the Boston region to examine past trends, identify regional safety issues, and set future targets for preferred performance. Tracking these measures helps to gauge the effectiveness of MPO transportation investments in reducing fatalities and serious injuries.
Overall, safety is improving in the region. Between 2008 and 2013, traffic fatalities (based on a rolling five-year average) decreased from 141 fatalities in 2008 to 123 in 2013. Figure 4-3 shows the change in traffic fatalities by mode during this period and indicates that the 13 percent decline in fatalities included fewer automobile, pedestrian, and bicycle fatalities. Similarly, total traffic crashes and injuries declined by 26 percent and 27 percent, respectively between 2008 and 2013.
FIGURE 4-3 Traffic Fatalities in the Boston Region by Mode, 2008−2013

Sources: MassDOT, National Highway Traffic Safety Administration Fatality Reporting System, and the MassDOT Crash Data System.
Despite these overall gains, crashes and injuries for pedestrians and bicyclists rose during this same period, as shown in Figure 4-4. Between 2008 and 2013, roughly two-thirds of pedestrian and bicycle crashes resulted in an injury. For pedestrians, the number of crashes increased by 17 percent and injuries grew by 33 percent. For bicycles, the number of crashes increased by 25 percent and injuries also jumped by 33 percent.
In addition to pedestrian and bicycle safety issues, there are still a number of high-crash locations throughout the Boston Region MPO area, including nearly 80 of the Top-200 Crash Locations statewide.
FIGURE 4-4 Traffic Injuries in the Boston Region by Mode, 2008−2013

Sources: MassDOT, National Highway Traffic Safety Administration Fatality Reporting System, and the MassDOT Crash Data System.
The rate of traffic fatalities and injuries also has declined steadily between 2008 and 2013. Figure 4-5 shows the change in the traffic fatality rate and traffic injury rate (based on 100 million vehicle-miles traveled (VMT)) in the Boston region between 2008 and 2013. During this period, the traffic fatality rate steadily declined by 13 percent from 0.55 fatalities per 100 million VMT to 0.47 fatalities per 100 million VMT. The traffic injury rate dropped by 27 percent from 90 injuries per 100 million VMT to 63 injuries per 100 million VMT between 2008 and 2013.
FIGURE 4-5 Total Traffic Injury Rate and Traffic Fatality Rate (per 100 million VMT) in the Boston Region, 2008–13

In prioritizing its capital investments, the MPO uses TIP project-evaluation criteria to support the goal of reducing crash severity for all modes. These criteria assess severity of the safety need by capturing the weighted index of crashes in the project area; and assess the safety impact of proposed projects by considering the proposed safety countermeasures.
Within the TIP’s MPO Target Program, 16 proposed investments will improve safety at 35 high-crash locations to reduce crash severity for all modes.
This intersection investment will provide safety improvements for automobiles, trucks, bicyclists, and pedestrians by implementing safety countermeasures at four high-crash locations: Derby Street, Whiting Street (Route 53) and Gardner Street in Hingham, Cabot Street at Dodge Street and Cabot Street at Rantoul Street in Beverly, and Route 1 at University Avenue in Norwood.
The Route 128 Add-a-Lane project will widen 3.25 miles of I-95 in Needham and Wellesley to install an additional 12-foot travel lane and 10-foot shoulder in each direction to address serious safety issues. The addition of a fourth full-time travel lane will eliminate use of the breakdown lane during peak periods; and adding collector roads between Highland Avenue and Kendrick Streets will provide safer weaving movements between the interchanges.
The FFYs 2017-21 TIP MPO Target Program proposes 15 Complete Streets projects that would implement safety improvements at 12 high-crash locations along corridors across the region. These corridor investments will provide safety improvements for automobiles, trucks, bicyclists, and pedestrians. In addition, improvements at these 15 corridors would provide safe and continuous accommodations for non-motorized users by adding 33 miles of new bicycle facilities and eight miles of new sidewalk.
For example, reconstruction of Route 85 (Maple St.) in Marlborough will implement safety countermeasures at two high-crash locations along the 1.1-mile corridor, as well as add new bicycle lanes and improve existing sidewalks. In addition, reconstruction of Ferry St. in Everett will improve safe access for pedestrians to businesses, schools, and bus stops along the corridor by providing continuous sidewalks and improved crossings.
System preservation is a priority for the MPO because the region’s transportation infrastructure is aging. The demands placed on highway and transit facilities have been taxing to the point that routine maintenance is insufficient to keep up with the need. As a result, there is a significant backlog of maintenance and state-of-good repair work to be done on the highway and transit systems, including bridges, roadway pavement, transit rolling stock, and traffic- and transit-control equipment.
MassDOT’s program monitors approximately 4,150 lane miles of interstate, arterial, and access-controlled arterial roadways in the Boston Region MPO area. It has been the policy of the MPO not to fund resurfacing-only projects in the TIP. However, the MPO does make funding decisions for roadway reconstruction projects that include resurfacing, usually full-depth reconstruction, in addition to other design elements.
Figure 4-6 displays the number of lane miles in good or better condition by roadway classification between 2009 and 2013 in the Boston Region MPO area. The figure indicates that the lane miles of interstates, access-controlled arterials, and arterials in good or better condition on MassDOT-maintained roadways has remained constant between 2009 and 2013.
FIGURE 4-6 Lane Miles of Pavement in Good or Better Condition in the Boston Region MPO by Roadway Classification
Source: MassDOT Pavement Management Program.
Approximately 70 percent of roadway lane miles are in good condition, 25 percent are in fair condition, and five percent are in poor condition—which meets MassDOT’s performance measure of at least 65 percent of the pavement in good condition. However, MassDOT-maintained arterial roadways continue to account for a disproportionate share of substandard roadway lane miles. Arterials accounted for 62 percent of the monitored roadways, but nearly 90 percent of the roadways that are in substandard condition (see Figure 4-7).
FIGURE 4-7 Pavement Condition in the Boston Region MPO by Roadway Classification
 Source: MassDOT Pavement Management Program.
MassDOT also monitors the condition of its bridges across the state. There are 2,866 bridges located within the Boston Region MPO area, of which some are in substandard condition because they have been deemed by MassDOT bridge inspectors as structurally deficient, functionally obsolete, or posted.
Figure 4-8 displays the number of substandard bridges in the Boston Region MPO by condition between 2007 and 2014. As seen in the figure, the percentage of structurally deficient bridges decreased slightly from six to five percent, functionally obsolete bridges remained constant at 19 percent, and posted bridges declined from seven to four percent.
FIGURE 4-8 NUMBERS of Substandard Bridges in the Boston Region MPO by Condition

Source: MassDOT Bridge Inventory.
In prioritizing its capital investments, the MPO uses TIP project-evaluation criteria to assess how well each project improves pavement and signal condition to advance the MPO’s goal of maintaining a state of good repair.
Virtually all of the TIP’s MPO Target Program investments advance the MPO’s system preservation goal to maintain the transportation system by improving pavement condition, traffic signal equipment, or sidewalk infrastructure, or by prioritizing projects that improve emergency response or ability to respond to extreme conditions. In addition, the Target Program investments contribute modestly to bridge preservation by addressing 11 substandard bridges. Yet, the MassDOT Bridge Program remains the primary funding source for replacement or rehabilitation of substandard bridges.
The FFYs 2017-2021 TIP’s MPO Target Program investments propose to improve 68 miles of substandard pavement traveled daily by nearly 670,000 vehicles, and 45 miles of substandard sidewalk’ and replace more than 90 traffic signals, and 11 substandard bridges (10 functionally obsolete and one structurally deficient) traveled daily by approximately 340,000 vehicles. In addition, there are 15 projects that will improve emergency response or ability to respond to extreme conditions, thus aiming to make significant progress toward maintaining the region’s transportation system.
The FFYs 2017–2021 TIP’s MPO Target Program proposes to improve substandard pavement at three intersections and modernize signal equipment at four intersections. These investments will also improve emergency response by updating intersections along an evacuation route and in close proximity to emergency support locations.
The FFYs 2017-2021 TIP Target Program proposes to resurface or reconstruct more than 35 miles of substandard pavement, replace more than 50 traffic signals, repair 25 miles of sidewalk infrastructure, and rehabilitate one substandard bridge on an arterial roadway. In addition, there are eight projects that will improve emergency response or ability to respond to extreme conditions, thus aiming to make significant progress toward maintaining the region’s transportation system.
The reconstruction of Ferry Street in Everett will resurface more than three miles of substandard pavement while bringing six traffic signals, substandard sidewalks, street lighting, signs, and pavement markings into a state of good repair.
Reconstruction of Route 1A in Walpole will resurface nearly five miles of substandard pavement, repair five miles of substandard sidewalk, signalize four intersections, and improve one substandard bridge.
The FFYs 2017-2021 TIP’s MPO Target Program proposes to resurface or reconstruct 30 miles of substandard pavement, approximately 20 miles of sidewalk infrastructure, and 10 substandard bridges. In addition, there are six projects that will improve emergency response or ability to respond to extreme conditions, thus aiming to make significant progress toward maintaining the region’s transportation system.
Reconstruction of Highland Avenue and Needham Street in Newton and Needham will resurface nine miles of substandard pavement, six miles of sidewalk infrastructure, and one substandard bridge, while bringing traffic signals, street lighting, signs, and pavement markings into a state of good repair.
The Route 128 Add-a-Lane project will replace one structurally deficient and three functionally obsolete bridges as part of widening I-95 in Needham and Wellesley.
Through its capacity management and mobility goal and objectives, the MPO seeks to maximize the region’s existing transportation system so that both people and goods can move reliably and connect to key destinations. The Boston region is mature, which creates challenges to making major infrastructure changes to its transportation system.
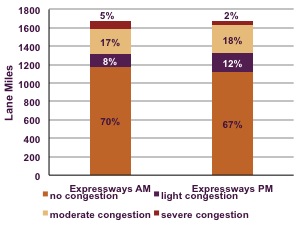
In order to determine how well the region’s roadways are performing, the MPO applies performance measures that gauge the duration, extent, intensity, and reliability of congestion. MPO staff analyzed congestion in the region using the CMP Express Highway and Arterial Performance Dashboards to establish a baseline for future comparison. Figure 4-9 displays the percentage of lane miles of congestion as measured by travel time index on the CMP expressway network. In the Boston Region MPO area, 22 percent of all expressway lane miles in the AM peak period and 20 percent of all expressway lane miles in PM peak period experience moderate-to-severe congestion.
FIGURE 4-9 Lane Miles of Congestion in the Boston Region MPO: CMP Monitored Expressways
Moving forward, the MPO will continue to monitor congestion data of the roadway network to track performance of the system. This annual analysis will depend on routinely updated data sources, which may require the purchase of INRIX data or other comparable data.
In prioritizing its capital investments, the MPO uses TIP project-evaluation criteria to assess how well each project expands transportation options to advance the MPO’s goal of managing capacity and improving mobility.
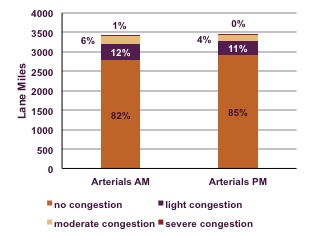
FIGURE 4-10 Lane Miles of Congestion in the Boston Region MPO: CMP-Monitored Arterials
The MPO seeks to manage capacity on its transportation network and improve mobility for its users by extending transit service to support non-single-occupancy-vehicle (SOV) travel options, adding roadway capacity at select MPO-identified bottleneck locations, and implementing traffic and operational improvements along congested corridors.
The FFYs 2017-2021 TIP Target Program investments propose to add 53 miles of bicycle lanes, 13 miles of new sidewalk, and improve access to transit at 21 locations. In addition, these investments would improve more than 90 traffic signals, resulting in nearly 7,900 hours of reduced daily vehicle delay.
The FFYs 2017-2021 TIP Target Program proposes to add 33 miles of bicycle lanes (including almost a mile of separated bicycle lanes), eight miles of new sidewalk infrastructure; and improve access to transit along 14 corridors. These investments also would improve traffic flow along corridors that serve more than 800 bus trips on a typical weekday, resulting in 15 fewer hours of daily transit vehicle delay.
For example, reconstruction of Route 126 (Pond Street) in Ashland will transform the corridor by adding sidewalks and bicycle lanes where no facilities currently exist. These improvements for bicyclists and pedestrians will provide the necessary facilities to support existing MWRTA bus services in the corridor. In addition, the Gateway East project in Brookline will provide safe access for bicyclists by implementing bicycle lanes that physically separate the facility from the travel lane to reduce conflicts between motorists and bicyclists.
The FFYs 2017–2021 TIP Target Program proposes to add 16 miles of bicycle lanes, nearly four miles of sidewalk infrastructure, and improve access to transit along five corridors. These investments also would improve corridors that serve nearly 600 bus trips on a typical weekday.
Middlesex Turnpike Improvements (Phase III) in Bedford, Billerica, and Burlington will continue improvements to the corridor by adding three miles of sidewalks and bicycle lanes where no facilities currently exist. These improvements will support LRTA bus service along the Middlesex Turnpike.
Reconstruction of Route 18 (Main Street) in Weymouth will improve one moderate MPO-identified arterial bottleneck location by widening a four-mile section of the corridor from two to four lanes. In addition, the project will expand transportation options by adding eight miles of bicycle lanes.
The Route 128 Add-a-Lane project will improve one severe MPO-identified express highway bottleneck location by widening 3.25 miles of I-95 in Needham and Wellesley.
Historically, some minority and economically disadvantaged areas have endured the negative effects of the transportation system disproportionally—for example, via placement of infrastructure from which they do not benefit; poor access to, or maintenance of, necessary services; and by not being included in the transportation-planning process. In addition, youth, the elderly, and people with disabilities of various kinds face special challenges when using the transportation system.
To advance the MPO’s Transportation Equity (TE) goal of providing comparable transportation access and service quality among communities regardless of income level or minority status, the MPO has broadened its equity analysis beyond low-income and minority populations to also include: Limited-English Proficiency individuals (persons who live in households in which no one older than 14 speaks English “very well”), elderly (persons 75 or more years old), zero-vehicle households, and persons with disabilities.
The MPO considers the six factors to designate degrees of potential disadvantage. For example, an area with five or six indicators above the threshold percentage would be considered as having high potential for disadvantage, while an area with only one indicator above the threshold percentage would be considered as having low potential for disadvantage.
Table 4-3 provides a breakdown of the indicators considered by the MPO in the region, and their percentage of the region’s population.
TABLE 4-3 Indicators of Potential Disadvantage Thresholds
Indicator of Potential Disadvantage |
Population |
MPO Total |
Threshold |
Minority |
844,149 |
3,036,508 |
27.8% |
Low-income |
327,943 |
3,036,508 |
10.8% |
Limited English Proficiency* |
187,702 |
3,036,508 |
6.2% |
Age (75+) |
211,365 |
3,161,885 |
6.7% |
Persons with Disabilities** |
309,406 |
3,130,080 |
9.9% |
Zero Vehicle Households |
195,460 |
1,243,196 |
15.7% |
*Population five years of age and older in households where no one older than the age of fourteen speaks English “very well”. **Noninstitutionalized population.
Source: 2010 U S Census, 2012 American Community Survey.
The MPO’s transportation investments advance transportation equity by prioritizing projects that serve Title VI/non-discrimination populations, which include minority, low-income, limited-English proficiency, elderly, and zero-vehicle household populations, as well as persons with disabilities. In other words, the MPO prioritizes investments in areas that have been indicated as having a higher potential for disadvantage.
Table 4-4 provides a summary comparison of the Title VI/non-discrimination population served to total population served by MPO investments. The table indicates that the percentage served is higher than the threshold percentage for each indicator. These results reflect the MPO’s priority for investments in areas that have been identified as having a higher potential for disadvantage.
TABLE 4-4 Indicators of Potential Disadvantage Thresholds
Indicator of Potential Disadvantage |
Title VI/non-discrimination Population Served |
Total Population Served |
Percent Served |
Minority |
138,618 |
323,265 |
42.9% |
Low-income Households |
50,815 |
128,028 |
39.7% |
Limited English Proficiency* |
53,531 |
304,904 |
17.6% |
Age (75+) |
44,555 |
323,265 |
13.8% |
Persons with Disabilities** |
32,631 |
320,135 |
10.2% |
Zero Vehicle Households |
35,947 |
128,028 |
28.1% |
*Population five years of age and older in households where no one older than the age of fourteen speaks English “very well”. **Noninstitutionalized population.
Source: 2010 U S Census, 2012 American Community Survey.
The Boston Region MPO agrees that greenhouse gas emissions (GHGs) contribute to climate change. If climate trends continue as projected, the conditions in the Boston region will include a rise in sea level coupled with storm-induced flooding, and warmer temperatures that would affect the region’s infrastructure, economy, human health, and natural resources. Massachusetts is responding to this challenge by taking action to reduce the GHGs produced by the state, including those generated by the transportation sector. To that end, Massachusetts passed its Global Warming Solutions Act, which requires reductions of GHGs by 2020, and further reductions by 2050, relative to 1990 baseline conditions.
In prioritizing its capital investments, the MPO uses TIP project-evaluation criteria to assess the projected transportation-related emissions impact of each project to advance the MPO’s goal of promoting clean air and clean communities.
The MPO’s transportation investments advance clean air/clean communities by prioritizing projects that reduce GHGs and other transportation-related emissions as well as those that address environmental impacts.
The FFYs 2017–2021 TIP Target Program investments are estimated to reduce more than 8,700 annual tons of CO2 and more than 18,000 annual kilograms of VOC, NOx, and CO because of traffic flow improvements and increased bicycle and pedestrian travel.
The FFYs 2017–2021 TIP Target Program proposes to reduce more than 5,600 annual tons of CO2 and more than 12,500 annual kilograms of VOC, NOx, and CO because of traffic flow improvements and increased bicycle and pedestrian travel.
Reconstruction of Boylston Street in Boston will provide significant reductions in vehicle delay through improvements at five intersections, and encourage increased bicycle and pedestrian trips through safer pedestrian crossings and new bicycle lanes.
Reconstruction of Derby Street in Hingham will provide significant reductions in vehicle delay through new signalization at the Route 3 ramps. The project will also encourage increased bicycle and pedestrian trips via new sidewalk and bicycle lanes.
The FFYs 2017–2021 TIP Target Program proposes to reduce more than 1,400 annual tons of CO2 and nearly 2,700 annual kilograms of VOC, NOx, and CO because of traffic-flow improvements and increased bicycle and pedestrian travel.
Reconstruction of Highland Avenue and Needham Street in Newton and Needham will provide significant reductions in vehicle delay through improvements at five intersections, and encourage increased bicycle and pedestrian trips via safer pedestrian crossings and new bicycle lanes.
One of MetroFuture’s implementation strategies is to focus on economic growth, and coordinate transportation investments to guide economic growth in the region. Metropolitan Area Planning Council (MAPC) worked with Executive Office of Housing and Economic Development (EOHED) and the Executive Office of Energy and Environmental Affairs (EOEEA) to identify local, regional, and state-level priority development and preservation areas in municipalities within the MPO area. MAPC staff worked with municipalities and state partners to identify locations throughout the region that are principal supporters of additional housing, employment growth, creation and preservation of open space, and the infrastructure improvements required to support these outcomes for each location.
This process identified locations that are best suited to support the type of continued economic vitality and future growth that the market demands, and which communities desire. Identifying these key growth and preservation locations also helps MAPC, the Boston Region MPO, and state agencies to understand both the infrastructure and technical-assistance needs better, in order to help them prioritize the limited regional and state funding.
The MPO has not yet established performance measures to track the coordination of land-use development and transportation investments. However, the MPO uses TIP project-evaluation criteria to assess how well each project advances MetroFuture land-use planning. This means supporting investments in already-developed locations of residential or commercial/industrial activity, locations with adequate sewer and water infrastructure, areas identified for economic development by state, regional, and local planning, and areas with a relatively high density of existing development.
The MPO’s transportation investments advance economic vitality by prioritizing projects that support access to targeted development areas for multiple modes and serve areas of concentrated development. The FFYs 2017–2021 TIP Target Program proposes 17 investments that provide multimodal access to targeted development areas and 24 investments that serve areas of concentrated development.
The FFYs 2017–2021 TIP Target Program proposes 10 projects that provide multimodal access to targeted development areas that are well suited to support continued economic vitality and future growth. For example, reconstruction of Route 85 (Maple Street) will provide access to a 43D site located at the former Lucent site in Marlborough and reconstruction of Route 27 (North Main Street) will provide access to a 40R site located at the former Paperboard site at 182 North Main Street in Natick.
In addition, the reconstruction of Highland Avenue and Needham Street in Newton and Needham will leverage other investments in the form of an EOHED Massworks award. This award will fund reconstruction of two intersections within the limits of the corridor reconstruction to address safety and congestion and support future development.
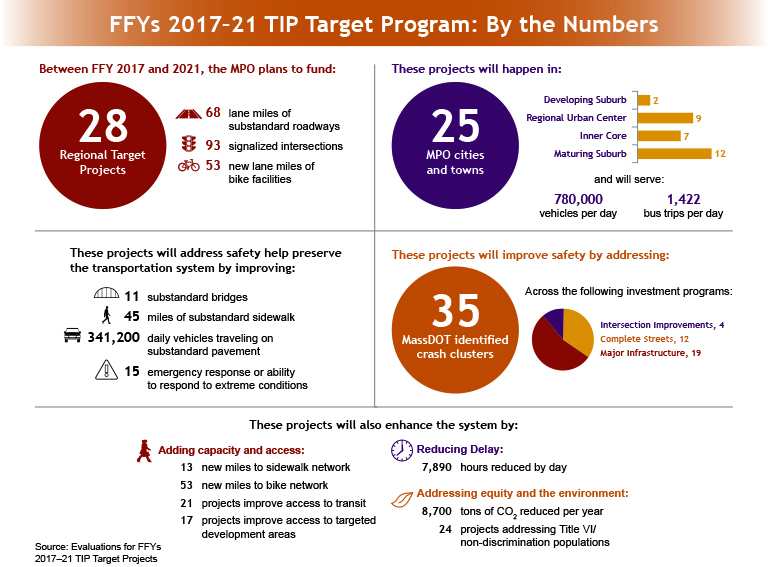
Figure 4-11 describes how the FFYs 2017–2021 Regional Target-funded projects address various performance areas.
Figure 4-11
Performance-based planning is an ongoing process that will continue to evolve as the MPO monitors and evaluates its planning and investment programs using performance measures. The MPO will advance performance-based planning through its core planning documents by:
In FFY 2017, the MPO will continue to monitor system-level trends and propose performance targets to guide investment decisions. If, in its annual monitoring, the MPO sees that it is not making progress toward its targets, then the organization would need to consider modifying investment or policy priorities, and weigh the tradeoffs involved.
For example, allocating a greater share of funding to intersection improvements at high-crash locations may make significant progress toward reducing traffic fatalities and serious injuries; however, it also may affect the MPO’s ability to meet system-preservation targets for pavement or bridge conditions. By continuously monitoring and evaluating its progress, the MPO will be able to make these difficult decisions across competing goals and objectives in a more informed manner, resulting in greater outcomes for all concerned.