Route 1A/Lynnway/Carroll Parkway Study in Lynn
Project Manager
Seth Asante
Project Principal
Mark Abbott
Data Analysts
Kathy Jacob
Katrina Crocker
Seth Asante
Graphics
Kenneth Dumas
Kim DeLauri
Cover Design
Jane Gillis
The preparation of this document was supported
by the Federal Highway Administration through
MHD 3C PL contracts #84053 and #33101.
Central Transportation Planning Staff
Directed by the Boston Region Metropolitan
Planning Organization. The MPO is composed of
state and regional agencies and authorities, and
local governments.
Following a selection process based on safety conditions, congested conditions, multimodal significance, regional significance, regional equity, and implementation potential, the Route 1A/Lynnway/Carroll Parkway arterial segment in Lynn was approved for study by the Boston Region Metropolitan Planning Organization (MPO). The roadway runs through an area that has been classified as a Commonwealth of Massachusetts Growth District, an important designation for older urban cities in need of increased tax bases and commercial and residential development. The City of Lynn has made major progress toward redevelopment by completing the physical and legal changes necessary to redevelop 305 acres of underutilized waterfront land. However, the current configuration and size of the Lynnway inhibits access to the waterfront—six-to-seven lanes of traffic act as a barrier, cutting off the waterfront from Lynn’s downtown and neighborhoods.
MPO staff, working with the study advisory task force, has developed short- and long-term alternatives that would transform the Lynnway and Carroll Parkway into a pedestrian- and bicyclist-friendly roadway as well as a transportation corridor that serves all modes of transportation and maintains regional travel capacity. This study provides the City of Lynn, the Department of Conservation and Recreation (DCR), the Massachusetts Department of Transportation (MassDOT), and other stakeholders with an opportunity to begin researching the needs of the Lynnway and Carroll Parkway—in light of the city’s vision for the Waterfront—and to start planning design and engineering efforts.
This report summarizes the analyses and improvement alternatives resulting from the study. The opening sections provide background information for the study by describing the existing conditions and problems. An assessment of the safety and operational problems, and a discussion of the potential improvement alternatives, follows the background sections. The report also includes technical appendices, which cite the methods used and data applied in the study, including detailed reports about the intersection and arterial capacity analyses. If implemented, the report’s recommendations would result in an improved roadway corridor: one where it is safe to walk or bicycle to shops, recreational areas, and work; that provides safer access to businesses; and where traffic operates efficiently.
2.2 Vision for the Lynn Waterfront
2.2.1 Redevelopment of the Waterfront
2.3 Study Goals and Objectives
3.2.1 Hanson Street Intersection
3.2.2 Harding Street Intersection
3.2.3 Commercial Street Intersection
3.2.4 Shepard Street/Marine Boulevard Intersection
3.2.5 Blossom Street Intersection
3.2.6 Kingman Street Intersection
3.2.7 Market Street Intersection
3.2.9 Broad Street (Route 1A) and Market Street Intersection
3.2.10 Broad Street, Washington Street, and Spring Street Intersection
4.1.2 Turning Movement Volumes
4.1.3 Pedestrian Traffic Volumes
4.1.7 Signal Timing and Layout Information
5.1.2 Intersection Crash Summary
5.2 Traffic Operations Analyses
5.3.1 Pedestrian and Bicyclist Issues
5.3.2 Traffic Safety and Operations Issues
6.1 Alternative 1: Short-Term Improvements
6.1.1 Improvements throughout the Corridor
6.1.2 Intersection-Related Improvements
Commercial Street Intersection:
Marine Boulevard/Shepard Street Intersection:
Pleasant Street/Broad Street Intersection:
Market Street Extension Intersection:
7.1 Alternative 2: Road Diet and Complete Street
7.2 Alternative 3: Boulevard Style Roadway
7.3 Alternative 4: Adding Pedestrian Bridges to the Lynnway
Option 1: Keep Existing Travel Lanes
Option 1: Keep Existing Travel Lanes
7.4 Alternative 5: Altered Traffic Circulation Pattern
7.5 Alternative 6: Bus Rapid Transit (BRT) Lanes
7.6.2 Selecting Preferred Alternatives
8.2 Connectivity Potential for mINOR Streets
The Boston Region MPO’s Long-Range Transportation Plan (LRTP), Charting Progress to 2040, identified needs for all modes of transportation in the MPO region.1 This plan guides decision making about which projects to include in current and future Transportation Improvement Plans (TIPs).2 Projects address the region’s current mobility needs, focusing on maintaining and modernizing roadways with high levels of congestion and safety problems; expanding the quantity and quality of walking and bicycling; and making transit service more efficient and modern. Based on previous and ongoing transportation planning work, including the Boston Region MPO’s Congestion Management Process (CMP), the Massachusetts Bay Transportation Authority’s (MBTA) Program for Mass Transportation (PMT), and other MPO planning studies, the LRTP identified 52 arterial segments in 38 communities where highways need improvements.
To identify strategies and solutions for addressing the problems in some of these arterial segments, an arterial segment study was included in the federal fiscal year (FFY) 2015 Unified Planning Work Program (UPWP). An arterial segment study is a logical way to identify and address multimodal transportation needs in a corridor. Typically, these studies use a holistic approach that analyzes services and then makes associated recommendations within the roadway’s right-of-way, and takes into account the needs of all abutters and users—pedestrians, bicyclists, motorists, and public-transportation riders.
During the past five years, the MPO has conducted five arterial segment studies, and municipalities have been receptive to them. The studies provide cities and towns with the opportunity to review the requirements of a specific arterial segment, starting at the conceptual level, before committing design and engineering funds to a project. If the project qualifies for federal funds, the study’s documentation also may be useful to the DCR, MassDOT, and the City of Lynn.
Chapter 2—Background and Objectives
Following a selection process based on safety conditions3, congested conditions4, multimodal significance5, regional significance6, regional equity7, and implementation potential8, the Route 1A/Lynnway/Carroll Parkway arterial segment in Lynn was approved on April 2, 2015, for study by the Boston Region MPO from a short list of 52 arterial segments. DCR, MassDOT Highway Division District 4, Metropolitan Area Planning Council (MAPC), and the City of Lynn supported the study, and participated by collecting the data needed for the analyses.
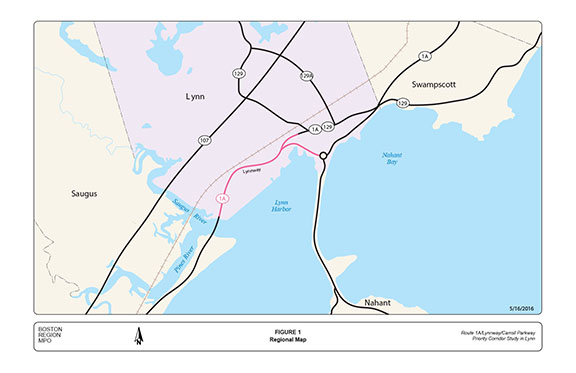
Figure 1 shows a regional map with the segment of focus indicated in red (all figures are included at the end of the report). The City of Lynn is pursuing redevelopment of the Lynn Waterfront, and because of this mission it conducted a comprehensive Masterplan for the waterfront in 2007.9 Presently, the Lynnway and Carroll Parkway present a barrier to connecting the Lynn downtown area to businesses and developments along the Lynn Waterfront. Safety for pedestrians and bicyclists using the Lynnway and Carroll Parkway is a major concern that affects development of the Lynn Waterfront. Lack of accommodations for bicycles and long crosswalks (as long as 100 feet) discourage pedestrians and bicyclists from using the roadway.
Over the past decade, during some of the most trying economic times, the City of Lynn made major progress by completing the physical and legal changes necessary to develop 305 acres of its waterfront land, some of the most underutilized waterfront land along the entire US Eastern Seaboard. In June 2006, the city partnered with Sasaki Associates and implemented a comprehensive waterfront Master Plan and Municipal Harbor Plan that will guide development on these waterfront parcels:10
Staff estimate that a fully implemented plan and built-out waterfront would provide almost 10,000 construction jobs, 5,000 permanent jobs, and approximately $18 million in annual property tax revenue
In addition, the City of Lynn implemented a comprehensive set of zoning regulations for this area that will transform the waterfront plans into easily understandable city ordinances, streamlining the permitting process by which development can occur. The city, through the Economic Development Industrial Corporation (EDIC), finished and implemented an MBTA ferry terminal and service, designed to supplement the existing MBTA commuter rail and bus service, and situated it within 100 yards of the waterfront. The area has also been classified a Commonwealth of Massachusetts Growth District, an important designation for older urban cities in need of increased tax bases and commercial and residential development. The city partnered with National Grid, General Electric, and a number of other private entities to relocate two large 115 kV power lines that had been inhibiting waterfront development for more than 40 years. Together, these actions have resulted in the sale of two major parcels of land—specifically, the so-called Beacon Chevrolet site and the General Electric (GE) Gear plant are under agreement and are now primed for development.
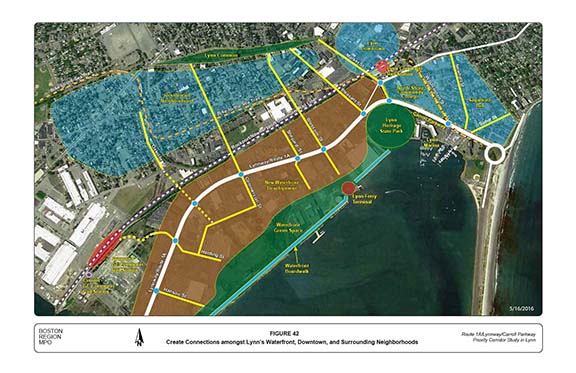
The next major step is to create public access, transforming the waterfront into a vibrant destination point with direct linkage to Lynn's downtown and surrounding neighborhoods. The current configuration and size of the Lynnway inhibits access to the waterfront—six-to-seven lanes of traffic act as a barrier, cutting off the waterfront from residents and tourists. Balancing the needs of vehicular commuters with the need for pedestrian and bicycle access to the waterfront is critical to making the city’s vision a reality.
The proposed GE commuter rail stop and waterfront access from this stop across the Lynnway are necessary developments. Much like Storrow Drive and the Charles River, the city is envisioning a boardwalk along the full length of the waterfront; therefore, access from the other side of the Lynnway and Carroll Parkway is essential to its full use. In addition, the city anticipates that small retail businesses will continue to sprout up on the waterside of the Lynnway and that access will be essential to their sustainability. Thousands use the Lynn Ferry and thousands more would join them if access were more readily available via bicycle or on foot. Lastly, the need for safe havens in addition to overpasses is essential to the safety of those crossing the Lynnway. In all, access to the waterfront from neighborhoods and downtown is a vital component to the future of the City of Lynn.
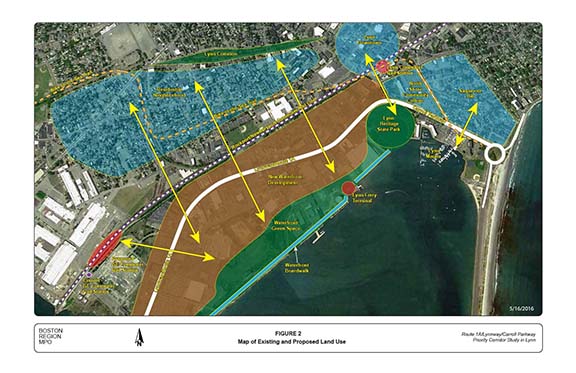
Figure 2 shows the land uses surrounding the Lynnway and Carroll Parkway, including the Lynn downtown area, neighborhoods, transportation centers and terminals, and the waterfront developments. Objectives of this study were to document existing problems, and develop multimodal improvements for them:
The objectives include considering short- and long-term improvements that address Lynn’s vision of the waterfront. Keeping in mind the problems in the arterial segment and the suggestions made by the study’s task force, the study focused on evaluating roadway cross-sectional modifications to improve safety and mobility and make the roadway more accommodating for both pedestrians and bicyclists.
An advisory task force—composed of representatives from Lynn, DCR, MAPC, MassDOT, and state legislators from Lynn—was established to participate in this study. MPO staff met with the task force twice: the first meeting discussed the work scope and existing problems, such as lack of accommodation for bicyclists, long crosswalks, lack of pedestrian refuge areas, high speeds of vehicles, and the Lynnway presenting a barrier between the Lynn Waterfront and downtown and neighborhoods. The second meeting presented the existing conditions, analyses and improvements and obtained comments. This report reflects the task force’s feedback. Appendix A includes a list of task force members and their comments.
Chapter 3—Characteristics of the Corridor
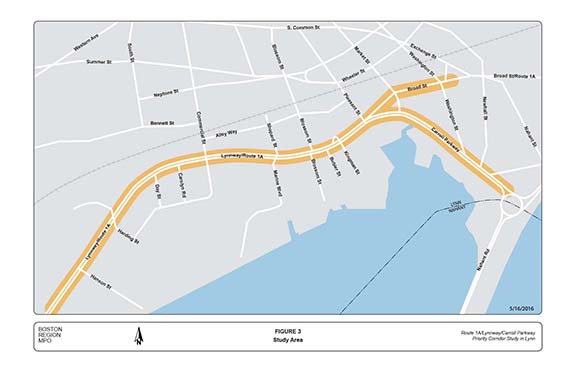
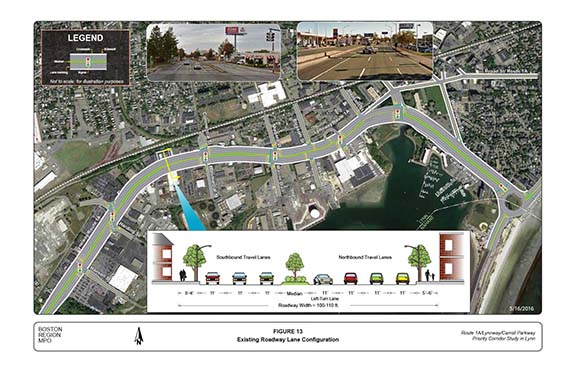
The Lynnway and Carroll Parkway corridor, approximately two miles long, is a six-lane divided roadway with turn lanes and a median at designated locations. Figure 3 shows the map of the study area. The two roadways create a continuous artery, and thus are both directionally designated as north-south principal arterial roadways under the jurisdiction of the DCR. They connect several communities to the north of Lynn, including Swampscott, Salem, Marblehead, and Nahant, as well as several communities to the south of Lynn, such as Revere, Boston, Chelsea, and Everett. In addition, the roadways provide access to Lynn’s downtown area, neighborhoods, transportation centers and a ferry terminal close to the study area. The roadways are classified as “urban principal arterial” on the National Highway System (NHS) program, making them eligible for federal funds. The right-of-way varies between 100 and 110 feet wide, the posted speed limit is 35 miles per hour (mph) in both directions and the land uses adjacent to the roadway are mixed—commercial, residential, and recreational. The following characterizes the current conditions in the corridor:
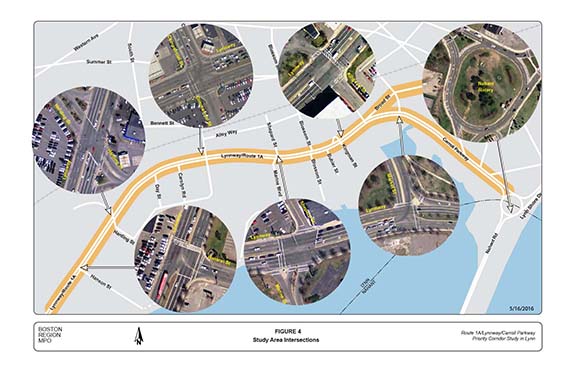
Several minor arterials and collector roadways intersect the Lynnway and Carroll Parkway, resulting in seven signalized intersections and a rotary along the corridor, which are described below.
Hanson Street is a city-owned local street that intersects the Lynnway to form a three-leg signalized intersection, as shown in Figure 4. Each of the Lynnway’s approaches has three through lanes. An exclusive left-turn lane has been provided on the southbound Lynnway approach for access to the businesses on Hanson Street. Hanson Street has two lanes at the approach: one for turning left and one for turning right. The intersection has a fully actuated traffic signal with functioning pedestrian signals with pushbuttons for crossing the Lynnway. The traffic signal heads are a mixture of mast-arm and post mounts. A bus stop is located at the intersection in each direction of the Lynnway; however, only the northbound side has a bus shelter with a bench. Walmart, Pride Hyundai and KIA, Dollar Tree, and several automobile service shops are located at the intersection.
Harding Street is a city-owned local street that intersects the Lynnway to form a four-leg signalized intersection (Figure 4). Each of the Lynnway’s approaches has three through lanes and an exclusive left-turn lane. Each approach on Harding Street has two travel lanes: on the westbound approach (one for left/through turns and one for right turns) and on the eastbound approach (one for left turns and one for through/right turns). The intersection has a fully actuated traffic signal and the signal heads are a mixture of mast-arm and post mounts. There are crosswalks with curb ramps for crossing Harding Street, but there is no crosswalk across the busy Lynnway. The intersection lacks pedestrian signals. A bus stop is located in each direction of the Lynnway, but only the one on the northbound side has a shelter with a bench. The intersection curb radii are adequate for trucks and buses servicing commercial and retail businesses in the area. Pride Chevrolet, Atlantic Toyota and Scion, a Mobil gas station and a KFC restaurant are located at the intersection. In the future, Harding Street could be extended and improved to provide direct connection to the proposed GE commuter rail station and to the waterfront.
Commercial Street is a city-owned minor arterial that intersects the Lynnway to form a four-leg signalized intersection, as shown in Figure 4. The intersection is one of the critical intersections in the corridor (high traffic volumes on both streets). Near the intersection, Lynnway has four lanes on each approach: on the northbound approach (exclusive left-turn lane and three through lanes) and on the southbound approach (exclusive right-turn lane and three through lanes). Commercial Street provides direct access from the Lynnway to the residential areas west of the roadway and downtown Lynn; it has three travel lanes on the eastbound approach (exclusive left-turn lane, through lane, and exclusive right-turn lane). There is no westbound approach on Commercial Street because of the one-way outbound movement. The intersection has a fully actuated traffic signal and the signal heads are a mixture of mast-arm and post mounts. The intersection is equipped with functioning pedestrian signals and crosswalks with curb ramps at all corners. One bus stop is located in each direction of the Lynnway, but neither of them has a shelter. The intersection curb radii are adequate for trucks and buses servicing commercial and retail businesses in the area. The land uses in the vicinity are commercial: among the businesses located at the intersection are Shell and Spiro gas stations, Kelly Honda, Sleepy’s, and Midas Automotive Service.
Shepard Street and Marine Boulevard are city-owned local streets that intersect the Lynnway to form a four-leg signalized intersection, as shown in Figure 4. Each Lynnway approach has four lanes (exclusive left-turn lane and three through lanes). Shepard Street has one lane for all traffic movements and Marine Boulevard has two travel lanes at the approach: one for turning left and one for through/right turns. The intersection is equipped with a fully actuated traffic signal with functioning pedestrian signals for crossing the Lynnway. The signal heads are a mixture of mast-arm and post mounts. There are crosswalks with curb ramps for crossing Shepard Street and Marine Boulevard but they lack pedestrian signals with pushbuttons. One bus stop is located in each direction of the Lynnway, but neither of them has a shelter. Marine Boulevard provides access to the industrial area located east of the Lynnway; the intersection curb radii are adequate for trucks and buses. The land uses near the intersection are commercial and industrial: Honey Dew, Lynnway Mini Mall, and Harbor Place Mall are located close to the intersection on the west side of the Lynnway, and an industrial area is located at the waterfront.
Blossom Street is a city-owned major collector that, because of the Lynnway’s median, intersects the Lynnway to form two unsignalized T-intersections. Each of the Lynnway’s approaches has three through lanes and each approach of Blossom Street has one lane servicing all movements. There are crosswalks with curb ramps for crossing Blossom Street, but the Lynnway has no crosswalks. One bus stop is located in each direction of the Lynnway, but only the bus stop on the northbound side has a shelter with a bench. The intersection curb radii are adequate for trucks and buses servicing commercial businesses in the area. The land uses in the area are commercial and industrial services—Wendy’s, Dunkin’ Donuts, and Ferguson Showroom and Supplies are located at the intersection. In addition, the Lynn Ferry terminal is located on Blossom Street, about 800 feet from the intersection.
Because of the raised median at the intersection, only right-in right-out movements are allowed on Blossom Street. The operation results in circuitous traffic circulation for the thousands of commuters accessing or exiting the ferry terminal. A lack of crosswalks also puts pedestrians at risk when they try to cross the Lynnway to the business areas. There is a strong need to open the median on the Lynnway, add left-turn lanes and crosswalks, and signalize the intersection to provide safe and direct access to the ferry terminal. Pedestrian access to the businesses located at the intersection also would be enhanced by installing a crosswalk.
Kingman Street is a city-owned local street that intersects the Lynnway to form a T-intersection with modifications to allow northbound U-turns and access to businesses located on the west side of the intersection (Figure 4). Each of the Lynnway’s approaches has four lanes (exclusive left-turn lane and three through lanes). There are two lanes for traffic exiting from Kingman Street (exclusive right-turn lane and shared through/left-turn lane). The intersection has a fully actuated traffic signal with functioning pedestrian signals with pushbuttons. The signal heads for the traffic movements are a mixture of mast-arm and post-mounts. There are crosswalks with curb ramps for crossing the Lynnway and Kingman Street. A bus stop is located in the southbound direction of the Lynnway but not in the northbound direction. The intersection curb radii are adequate for trucks and buses. The land uses in the area are commercial, retail, and professional services: the Clocktower Business Center, Dunkin’ Donuts, and U-Haul are located at the intersection.
Market Street is a city-owned minor arterial that intersects the Lynnway and Carroll Parkway to form a T-intersection, as shown in Figure 4. It is a gateway to the Lynn downtown area. Each of the Lynnway and Carroll Parkway approaches has three through lanes. In addition, the Lynnway’s northbound approach has two exclusive left-turn lanes and the southbound approach of the Carroll Parkway has an exclusive right-turn lane. Market Street has two lanes on the approach; both are for turning left onto Carroll Parkway. The intersection has a fully actuated traffic signal with functioning pedestrian signals for crossing the Carroll Parkway and Market Street. The signal heads are a mixture of mast-arm and post mounts on the median and on the sidewalks. The intersection curb radii are adequate for trucks and buses. The land uses near the intersection are recreational and educational: the intersection provides access to the Lynn downtown area, North Shore Community College, Lynn Heritage Park, and the Lynn Waterfront.
The Nahant Rotary is a three-leg intersection, as shown in Figure 4. It is the intersection of Carroll Parkway, Lynn Shore Drive and Nahant Road. At the rotary Carroll Parkway has three lanes (exclusive right turn lane and two left turn lanes); Lynn Shore Drive and Nahant Road has two lanes on each approach. There are crosswalks with curb ramps on each leg of the rotary; two of the crosswalks (on Carroll Parkway and Lynn Shore Drive) are controlled with pedestrian signals. The land uses near the rotary are recreational and residential—Lynn Shore and Nahant Beach are located close to the intersection.
Broad Street is a city-owned minor arterial that intersects Market Street to form a four-leg signalized intersection (not shown in Figure 4 because of limited space). It is located about 350 feet west of the Lynnway and Carroll Parkway in the downtown area. The Market Street northbound approach has three lanes (exclusive right-turn lane, through lane, and shared through/left-turn lane) while the southbound approach has two lanes (shared through/left-turn lane and shared through/right-turn lane). Broad Street’s westbound approach has three lanes (exclusive right-turn lane, through lane, and shared through/left-turn lane). The intersection has a fully actuated traffic signal with functioning pedestrian signals for crossing at the intersection. The signal heads are a mixture of mast-arm and post mounts. There are crosswalks with curb ramps at all corners of the intersection. The intersection curb radii are adequate for trucks and buses. The land uses near the intersection are recreational, educational, and professional services. The North Shore Community College, Lynn Heritage Park, and the Central Square-Lynn commuter rail station and busway are located at or near the intersection.
Washington Street is a city-owned minor arterial that intersects Broad Street to form a complex five-leg signalized intersection (not shown in Figure 4 because of limited space). At the intersection, each approach of Broad Street has two lanes (shared through/left-turn lane and shared through/right-turn lane). Washington Street northbound has two lanes on its approach (exclusive left-turn lane and shared through/right-turn lane), while the southbound approach is a one-way street heading to the intersection. Spring Street is a two-way, two-lane street. The intersection has a fully actuated traffic signal with functioning pedestrian signals for crossing at the intersection. The signal heads are mixture of mast-arm and post mounts. There are crosswalks with curb ramps at all corners of the intersection and the curb radii are adequate for trucks and buses. The land uses near the intersection are recreational, educational, and professional services. The North Shore Community College, Lynn commuter rail station, Harbor Loft Apartments, and the Lynn Museum and Historical Society are located at the intersection.
Chapter 4—Existing Transportation
The MassDOT Highway Division’s Traffic Data Collection Section performed turning-movement counts (TMCs) at the study area’s signalized intersections in May 2015, while schools were in session. The counts were conducted during the weekday AM peak travel period (7:00 AM–9:00 AM), the PM peak travel period (4:00 PM–6:00 PM), and the Saturday midday travel period (12:00 AM–2:00 PM). Heavy vehicles such as school buses, transit buses, and trucks were counted separately. Pedestrian and bicycle counts were conducted simultaneously with the TMCs.
In addition, MassDOT Highway Division’s Traffic Data Collection Section conducted automatic traffic recorder (ATR) counts at seven locations on the Lynnway, Carroll Parkway, Broad Street, Washington Street, Nahant Road and Lynn Shore Drive. The ATR counts are continuous 48-hour traffic counts used to determine the average weekday traffic (AWDT) of a roadway. MassDOT Highway Division Traffic Data Collection Section also collected spot speed data at three locations on the Lynnway and Carroll Parkway. Similar to the ATR counts, the spot speed data are continuous 48-hour records. The TMC, AWDT, and spot speed data are included in Appendix B.
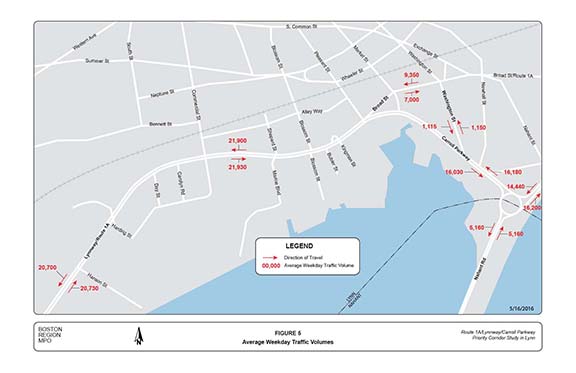
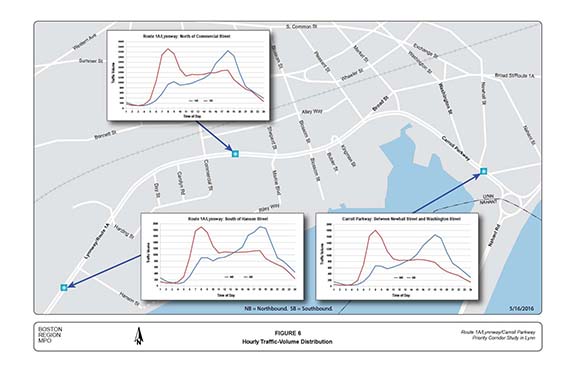
Figure 5 shows the AWDT at selected locations in the study area. The AWDT on the Lynnway ranges between 41,000 and 44,000 vehicles per day and between 30,000 and 33,000 vehicles on Carroll Parkway. Figure 6 shows the daily distribution of the hourly traffic volumes at three locations on the Lynnway and Carroll Parkway. The distributions show peak-period volumes in the range of 1,800 to 2,300 vehicles per hour in the southbound direction during the AM peak period and about the same volume in the northbound direction during the PM peak period. Outside of the four-hour AM and PM peak periods, the traffic volumes in each direction of the Lynnway and Carroll Parkway are less than 1,600 vehicles per hour. The theoretical capacity of a six-lane roadway is about 2,200 to 2,400 vehicles per hour per direction, and for a four-lane roadway capacity is about 1,600 to 1,800 vehicles per hour per direction. In other words, the Lynnway and Carroll Parkway have excess capacity during off-peak periods.
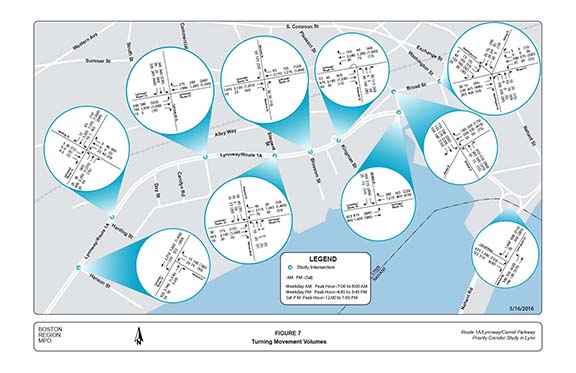
Figure 7 shows the turning movement volumes at the major intersections during the weekday AM peak hour (7:00-8:00 AM), weekday PM peak-hour (4:45-5:45 PM), and Saturday PM peak (12:00-1:00 PM). Based on the peak turning movement volumes, MPO staff determined that:
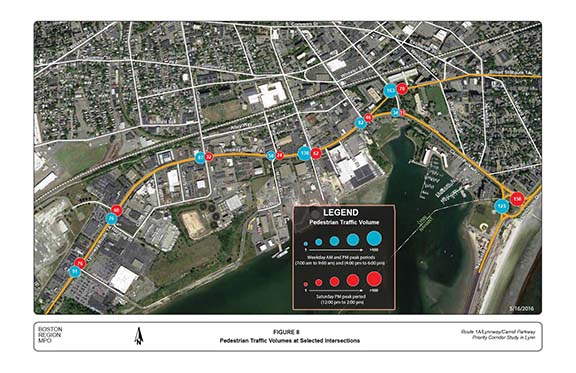
Figure 8 presents the number of pedestrians observed at the major intersections during the two-hour AM and two-hour PM peak periods on a weekday and the two-hour peak period on Thursday, May 28 and Saturday, May 30, 2015. These volumes may be low because of the colder weather in May and the high traffic volume during peak periods. Nonetheless, the retail, commercial, industrial, and recreational services, office buildings, and ferry and bus transit services along the Lynnway and Carroll Parkway generated significant pedestrian activity in the corridor, especially at the following intersections: Hanson Street, Harding Street, Commercial Street, Blossom Street, Kingman Street, Pleasant Street and Nahant Rotary.
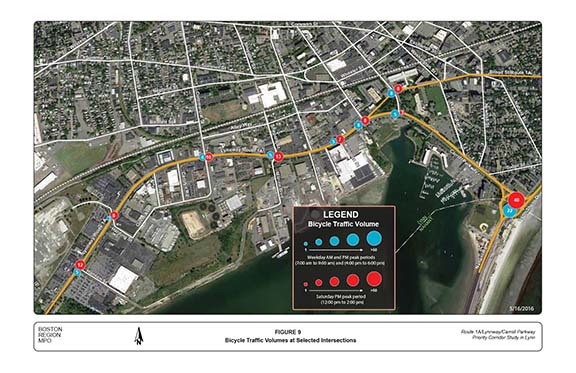
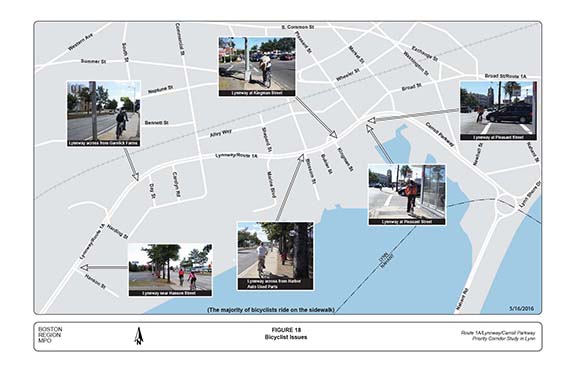
Figure 9 presents the number of bicyclists observed at the major intersections, during the two-hour AM and two-hour PM peak periods on a weekday and the two-hour peak period on Thursday, May 28 and Saturday, May 30, 2015. These volumes may be low because of the colder weather in May, high traffic volume during peak periods, and the lack of amenities that provide safety and comfort for bicyclists, such as functioning shoulders or bicycle lanes. In addition, the roadway setting of the Lynnway and Carroll Parkway is unfriendly and intimidating to bicyclists, as the six-lane roadway encourages high vehicular speeds, making bicycling unsafe. In addition, the high number of heavy vehicles exacerbates the existing problems. Despite these adverse conditions, the counts indicate moderate bicycle volumes in the corridor, the majority of which were observed riding on the sidewalk.
The percentage of heavy vehicles (light goods, buses, single-unit trucks, and articulated trucks) in the study-area intersections ranges between 8.0 and 11.0 percent on a weekday and between 6.0 and 9.0 percent on a Saturday. These rates are considered particularly high for peak-period traffic conditions. The percentages of heavy vehicles are included in the TMC (Appendix B).
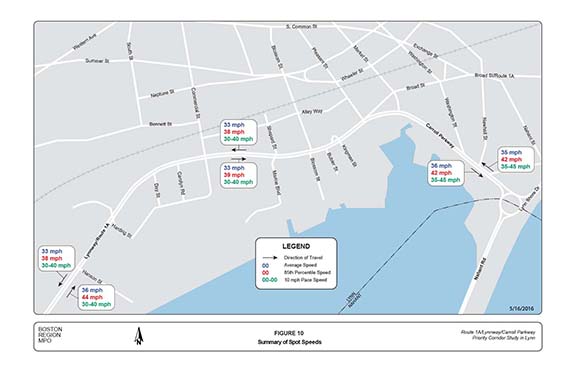
Figure 10 shows the results of the spot speed data collected on the Lynnway and Carroll Parkway. The average spot speeds observed in the corridor range between 33 and 36 mph, identical to the 35 mph posted speed limit. In addition, 85 percent of the drivers travel at 42 mph or slower. The spot speed data indicated that the majority of drivers—about 62 percent—travel between 30 mph and 40 mph, which is known as the 10-mph-pace speed. Analysis shows that between 10 and 15 percent of drivers travel in the 45-to-55 mph range, which is considerably higher than the posted speed limit.
DCR provided the existing signal timings, already-built traffic signal plans, and signal phase sequences of the signalized intersections (included in Appendix C). MPO staff used Google Maps and field visits to identify recent modifications to the intersection layouts and signal plans. The information was used to analyze existing traffic operations conditions.
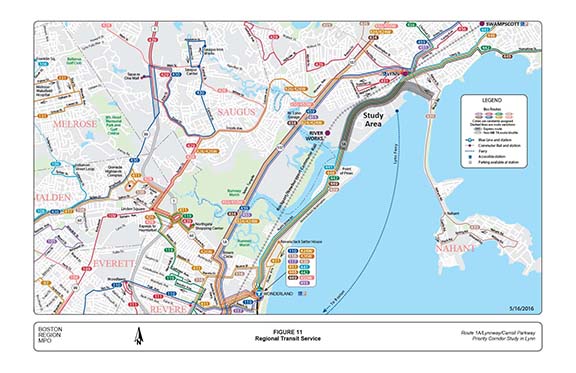
There are several public transportation services close to the Lynnway, including bus, commuter rail, ferry, and subway (Blue Line) services. These are displayed in Figure 11, a transit service map.
The MBTA operates six bus routes along the Lynnway:
These bus services connect Lynn and nearby communities to Central Square Station on the Newburyport Commuter Rail Line, Wonderland Station on the Blue Line, and Downtown Boston, including South Station. Routes 441, 442, 448, and 449 operate Monday through Friday every 10 minutes from 5:13 AM to 12:28 AM and Saturday through Sunday every 30 minutes from 6:06 AM to 12:39 AM. Route 439 operates only on weekdays, with five trips from Bass Point to Lynn at 6:30 AM, 7:30 AM, 2:25 PM, 6:05 PM and 6:52 PM; and five trips from Lynn to Bass Point at 6:15 AM, 7:10 AM, 2:08 PM, 5:44 PM, and 6:32 PM. The schedules of the six bus routes are included in Appendix D.
On the Lynnway, there are six bus stops in the northbound direction and nine in the southbound direction. Three of the bus stops in the northbound direction have shelters equipped with benches but none in the southbound direction have either. The lack of bus shelters creates inconveniences for passengers, especially during inclement weather. Table 1 below shows the bus service performance evaluation of each route in terms of service objectives: span, frequency, loading, schedule adherence, daily ridership, and average number of passengers per trip. The evaluation is based on the 2010 service delivery policy standard and spring 2011 schedule.
TABLE 1
Bus Service Evaluation, 2010–11
| Route Number |
Route Description |
Span |
Fre-quency |
Load- |
Schedule Adherence |
Daily Ridership |
Average Number of Passengers per Trip |
|---|---|---|---|---|---|---|---|
426 |
Central Square Lynn - Haymarket or Wonderland Station |
Pass |
Pass |
Pass |
55.0% |
2,006 |
28 |
439 |
Bass Point Nahant - Central Square Lynn |
Pass |
Pass |
Pass |
63.0 |
88 |
5 |
441 |
Marblehead - Haymarket or Wonderland Station via Paradise Road |
Pass |
Fail |
Fail |
49.0 |
1,442 |
37 |
442 |
Marblehead - Haymarket or Wonderland Station via Humphrey Street |
Pass |
Fail |
Fail |
52.0 |
2,112 |
28 |
448 |
Marblehead - Downtown Crossing |
Fail |
Pass |
Pass |
49.0 |
162 |
32 |
449 |
Marblehead - Downtown Crossing |
Fail |
Pass |
Pass |
52.0 |
181 |
30 |
Notes: “Pass” means the bus service meets the performance standards established for that service objective. “Fail” means the bus service does not meet the performance standards established for that service objective. “Span” is based on the 2010 service delivery policy standard for the route type and spring 2011 schedule; correcting this failure would always require additional resources. “Frequency” is based on 2010 service delivery policy standard for the route type and spring 2011 schedule; correcting this failure would always require additional resources.
“Loading” is based on the 2010 service delivery policy and same ridership data used above; standard is less than 140% of seated load averaged over 30-minute period during peak periods and less than 100% of seated load averaged over 60-minute period during off-peak periods; correcting this failure would always require additional resources.
“Schedule Adherence” is based on the 2010 service delivery policy (definition of this service objective varies by frequency of service and time point crossings for start/mid/endpoints of the bus route); percentage shown is the proportion of all time point crossings during fall 2010, which were on time; goal is 75 percent on time. Correcting this failure would NOT always require additional resources.
Source: Massachusetts Bay Transportation Authority.
Based on the performance evaluation presented in Table 1:
The Lynn Ferry service is a partnership between the Economic Development Industrial Corporation of Lynn (EDIC) and Boston Harbor Cruises. The service completed a two-year pilot program that started in 2014 and ended in 2016. Ridership in the first year of operation exceeded the projected estimate of 10,000 by more than 3,000 and much better success is expected in the second year of operation. The ferry operates seasonally, starting in May and running throughout the remainder of spring and summer, with stops at Blossom Street Landing (just off the Lynnway) and Central Wharf in Boston. There is ample free parking at the Blossom Street Landing and the trip takes about 30 minutes. The ferry service operates Monday through Friday with three departure trips from Lynn at 6:30 AM, 8:00 AM, and 6:30 PM; and three return trips from Central Wharf at 7:15 AM, 5:45 PM, and 7:15 PM. Information about ferry tickets and fares is included in Appendix D.
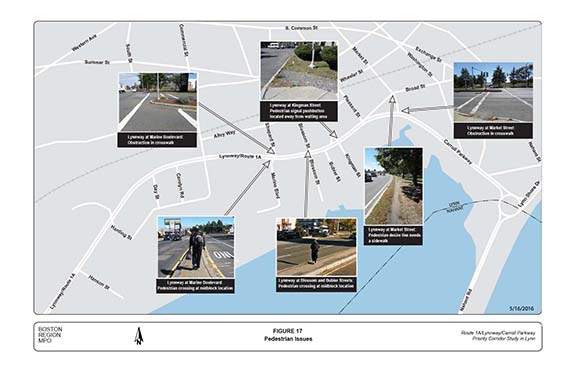
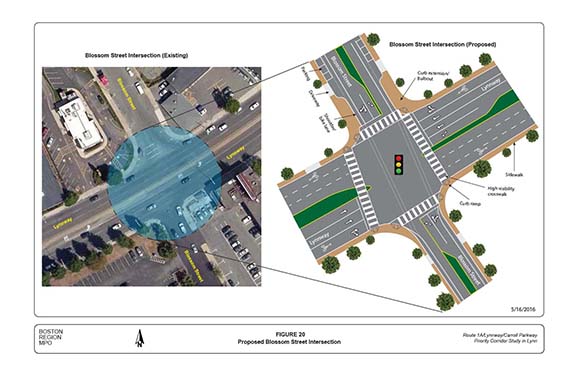
Currently, a raised median on the Lynnway at the Blossom Street intersection makes access to and from the Lynn Ferry terminal on Blossom Street difficult, as it prevents drivers from turning left onto Blossom Street. The raised median forces drivers southbound on the Lynnway heading to the ferry terminal to proceed to the Shepard Street/Marine Boulevard intersection then make a U-turn at the intersection and proceed back to Blossom Street in order to access the ferry terminal. Similarly, drivers from the ferry terminal heading to Commercial Street, Shepard Street, and Blossom Street have to proceed northbound on Lynnway to Kingman Street intersection, make a U-turn at that intersection, then continue southbound on the Lynnway in order to access those streets. These maneuvers put drivers and the growing number of commuters using the ferry terminal at risk.
In addition, many pedestrians and bicyclists cross the Lynnway at the Blossom Street intersection to access businesses located at the intersection and the ferry terminal. The absence of a pedestrian signal and marked crosswalks across the Lynnway compel pedestrians and cyclists to go to the adjacent signalized intersections in order to cross the busy Lynnway safely and legally, a maneuver which increases delay for pedestrians and bicyclists because of the extra distance involved. Therefore, many pedestrians and bicyclists still choose to cross the Lynnway at Blossom Street, which puts them at risk. These challenges to drivers, pedestrians, and bicyclists support the need for short-term improvements that will open the median at Blossom Street to provide safe and direct access to the ferry terminal and the businesses located at the intersection.
The MBTA Newburyport/Rockport Line has a station in Lynn at Central Square on Market Street. This MBTA station (just off the Lynnway) is also a transportation center connecting passengers to several bus lines. The commuter rail operates a full schedule Monday through Friday from 5:00 AM to 12:10 AM and an abbreviated service on Saturday and Sunday from 7:00 AM to 11:30 PM (the full train schedules are included in Appendix D). Peak-period frequency for both the inbound and outbound trains is approximately 30 minutes. The typical weekday boarding (inbound trains) at the station is about 700-to-800 passengers. There is parking at the Central Square station with 965 spaces, of which 23 are ADA accessible. The parking rate is $4.00 daily and the average weekday availability is 79 percent (very low utilization rate compared to the parking facilities at many other stations in the MBTA system).
There is also a plan to convert the GE commuter rail station, which currently serves only GE employees, into a full station servicing the future waterfront development. Connections from the Lynnway to the proposed GE commuter rail station and the waterfront development would be needed in order to provide direct and safe access amongst and between these locations.
Chapter 5—Existing Conditions Analyses
MPO staff used crash data from MassDOT’s Registry of Motor Vehicles database for January 2010 through December 2012 to evaluate safety for motorists, pedestrians, and bicyclists in the study area. The following sections describe the analyses and results of this safety assessment.
Table 2 presents a crash summary that identifies severity; manner of collision; road-surface, ambient-light, and weather conditions; number of bicyclists and pedestrians involved; and time of occurrence. The crash data is included in Appendix E.
TABLE 2
2010–12 Segment Crash Summary
| Crash Variable |
Lynnway |
Carroll Parkway |
|---|---|---|
Crash Severity |
-- |
-- |
Fatal injury |
2 |
0 |
Non-fatal injury |
52 |
12 |
Property damage only |
136 |
23 |
Unknown/not reported |
10 |
6 |
Manner of Collision |
-- |
-- |
Rear-end |
78 |
12 |
Angle |
56 |
4 |
Single vehicle crash |
32 |
17 |
Sideswipe, same direction |
23 |
8 |
Head-on |
4 |
0 |
Sideswipe, opposite direction |
2 |
0 |
Not reported/unknown |
5 |
0 |
Road Surface Conditions |
-- |
-- |
Dry |
150 |
33 |
Wet |
41 |
8 |
Sand, mud, dirt, oil, gravel, water, slush |
2 |
0 |
Snow |
4 |
0 |
Not reported |
3 |
0 |
Ambient Light Conditions |
-- |
-- |
Daylight |
145 |
27 |
Dark with lighted roadway |
39 |
13 |
Dark with roadway not lighted |
3 |
0 |
Dawn |
4 |
1 |
Dusk |
5 |
0 |
Not reported/unknown |
4 |
0 |
Weather Conditions |
-- |
-- |
Clear |
103 |
22 |
Cloudy |
27 |
4 |
Rain |
19 |
4 |
Snow/ice/freezing rain |
7 |
1 |
Not reported/unknown |
44 |
10 |
Bicyclists and Pedestrians Involved |
-- |
-- |
Bicyclist |
7 |
1 |
Pedestrian |
11 |
1 |
Time Period |
-- |
-- |
Peak period |
39 |
4 |
Off-peak period |
161 |
37 |
Total crashes |
200 |
41 |
Three-year average (rounded) |
67 |
13 |
Segment crash rate |
3.23 |
2.49 |
Principal arterial (other)—average statewide crash rate |
3.35 |
3.35 |
Note: The AM peak period is 7:00 AM-9:00 AM; PM peak period is 4:00 PM-6:00 PM.
Source: Central Transportation Planning Staff.
Between 2010 and 2012, there were241 crashes on the Lynnway and Carroll Parkway, involving 453 vehicles. These crashes resulted in 84 injuries (two of them fatal), meaning that injury crashes represent approximately 30 percent of crashes overall. The predominant crash types were rear-end, angle, single-vehicle crash, and same-direction sideswipe. Together, the crashes of these types constitute more than 94 percent of the crashes in the corridor. Many of these crashes occurred because of motorists running red lights, failing to yield right-of-way, following too close, and being inattentive or distracted. The segment crash rates for the Lynnway and Carroll Parkway were 3.23 and 2.49 crashes per million vehicles-miles traveled (MVMT), respectively. The most recent 2012 statewide average crash rate for an urban principal arterial is 3.35 crashes per MVMT.12 Overall, the segment crash rate for the Lynnway is close to the statewide average crash rate, but the segment crash rate for the Carroll Parkway is below the statewide average.
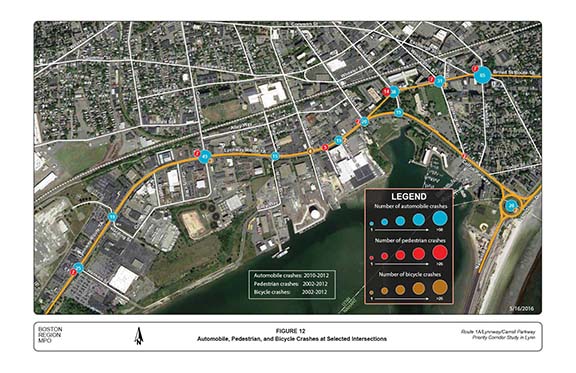
Figure 12 shows automobile, bicycle, and pedestrian crashes at the major intersections. Motorists, pedestrians, and bicyclists are exposed to risk because of the roadway design.
Table 3 presents a summary of crashes at the major intersections in terms of severity; manner of collision; road-surface, ambient-light, and weather conditions; number bicycles or pedestrians involved; and time of occurrence. For MassDOT Highway Division District 4 (which includes the City of Lynn), the average crash rate for signalized intersections is 0.73 crashes per million entering vehicles (MEV) and 0.56 MEV for unsignalized intersections.13 The crash rate worksheets are presented in Appendix F.
The analyses presented in Table 3 indicate higher-than-average crash rates for the following intersections:
As noted, two of the three intersections with high-crash rates (Lynnway and Commercial Street intersection and Carroll Parkway at Nahant Rotary) are on the list of the HSIP crash clusters and are eligible for HSIP funding. Based on the HSIP crash-cluster status, they also would require a road safety audit (RSA) to discuss additional safety countermeasures. An HSIP-eligible cluster is one in which the total number of "equivalent property damage only" crashes in the cluster is within the top five percent of all clusters in that region14.
TABLE 3
2010–2012 Crash Summary: Study Intersections
| Characteristics |
Hanson Street |
Harding Street |
Commercial Street |
Marine Blvd. |
Kingman Street |
Market Street |
Nahant Rotary |
|---|---|---|---|---|---|---|---|
Crash Severity |
-- |
-- |
-- |
-- |
-- |
-- |
-- |
Fatal injury |
2 |
0 |
0 |
0 |
0 |
0 |
0 |
Non-fatal injury |
12 |
3 |
13 |
3 |
13 |
5 |
7 |
Property damage only |
15 |
19 |
44 |
12 |
31 |
14 |
20 |
Not reported/unknown |
2 |
4 |
2 |
1 |
1 |
0 |
6 |
Manner of Collision |
-- |
-- |
-- |
-- |
-- |
-- |
-- |
Angle |
10 |
4 |
23 |
4 |
11 |
2 |
3 |
Rear-end |
7 |
16 |
21 |
6 |
18 |
9 |
8 |
Sideswipe, opposite direction |
1 |
0 |
1 |
0 |
0 |
0 |
0 |
Sideswipe, same direction |
2 |
3 |
3 |
3 |
6 |
5 |
8 |
Single vehicle collision |
8 |
2 |
9 |
2 |
8 |
3 |
14 |
Head-on |
0 |
1 |
2 |
1 |
0 |
0 |
0 |
Not reported/unknown |
3 |
0 |
0 |
0 |
2 |
0 |
0 |
Road Surface Conditions |
-- |
-- |
-- |
-- |
-- |
-- |
-- |
Dry |
23 |
20 |
44 |
10 |
37 |
14 |
27 |
Wet |
5 |
6 |
13 |
5 |
6 |
5 |
6 |
Snow |
1 |
0 |
1 |
1 |
2 |
0 |
0 |
Not reported/unknown |
2 |
0 |
1 |
0 |
0 |
0 |
0 |
Ambient Light Conditions |
-- |
-- |
-- |
-- |
-- |
-- |
-- |
Daylight |
24 |
17 |
45 |
12 |
35 |
8 |
22 |
Dark with lighted roadway |
1 |
8 |
11 |
3 |
9 |
7 |
11 |
Dark with roadway not lighted |
1 |
0 |
0 |
0 |
1 |
1 |
0 |
Dawn |
1 |
0 |
2 |
0 |
0 |
1 |
0 |
Dusk |
0 |
1 |
1 |
1 |
0 |
2 |
0 |
Not reported/unknown |
4 |
0 |
0 |
0 |
0 |
0 |
0 |
Weather Conditions |
-- |
-- |
-- |
-- |
-- |
-- |
-- |
Clear |
15 |
10 |
35 |
6 |
27 |
8 |
18 |
Cloudy |
5 |
5 |
5 |
2 |
6 |
4 |
3 |
Rain |
2 |
1 |
8 |
2 |
3 |
2 |
2 |
Snow |
2 |
0 |
0 |
2 |
1 |
1 |
1 |
Not reported/unknown |
7 |
10 |
11 |
4 |
8 |
4 |
9 |
Bicyclists and Pedestrians Involved |
-- |
-- |
-- |
-- |
-- |
-- |
-- |
Bicyclist |
0 |
0 |
3 |
0 |
0 |
0 |
1 |
Pedestrian |
4 |
1 |
2 |
0 |
2 |
1 |
0 |
Time Period |
-- |
-- |
-- |
-- |
-- |
-- |
-- |
Peak period |
4 |
9 |
12 |
3 |
11 |
7 |
5 |
Off-peak period |
27 |
17 |
47 |
13 |
34 |
12 |
28 |
Total Crashes (2010-2012) |
31 |
26 |
59 |
16 |
45 |
19 |
33 |
Three-year average crash rate |
10 |
9 |
20 |
5 |
15 |
6 |
11 |
Average crash rate |
0.71 |
0.57 |
1.07 |
0.35 |
0.93 |
0.45 |
0.89 |
MassDOT Highway Division District 4 average crash rate |
0.73 |
0.73 |
0.73 |
0.73 |
0.73 |
0.73 |
0.56 |
Notes: The AM peak period is 7:00 AM-9:00 AM; the PM peak period is 4:00 PM-6:00 PM.
Shading denotes an intersection with a high crash rate.
Source: Central Transportation Planning Staff.
MPO staff used police crash reports to prepare collision diagrams, which are useful for examining patterns and developing safety strategies.15 The collision diagrams, along with the crash records, are included in Appendix G. The collision diagram numbers uniquely identify each crash and may be used to cross-reference the crash records. According to the collision diagrams, rear-end and angle crashes, usually associated with signalized intersections, were the predominant crash type. Nine pedestrian crashes occurred at midblock locations on the Lynnway and two in crosswalks at intersections. Three bicycle crashes occurred in sidewalk locations with driveways. The roadway design is a major contributor to these crashes: it encourages high vehicular speeds, reduces pedestrian comfort, and does not provide a welcoming environment for pedestrians and bicyclists; and the long crosswalks and lack of pedestrian refuge areas create long pedestrian crossing times and unsafe crossing conditions.
Staff conducted traffic operations analyses consistent with the Highway Capacity Manual (HCM) methodologies.16 HCM methodology demonstrates driving conditions at signalized and unsignalized intersections in terms of a level-of-service (LOS) rating from A to F. LOS A represents the best operating conditions (little to no delay), while LOS F represents the worst operating conditions (long delay). LOS E represents operating conditions at capacity (limit of acceptable delay). Table 4 presents the control delays associated with each LOS for signalized and unsignalized intersections. Using the data collected, MPO staff built traffic analysis networks for the AM and PM peak hours and Saturday PM peak hour using Synchro traffic simulation software17 to assess the capacity and quality of traffic flow.
TABLE 4
Intersection Levels of Service Criteria, 2010
| Level of Service |
Signalized Intersection Control Delay |
Unsignalized Intersection Control Delay |
|---|---|---|
A |
0-10 |
0-10 |
B |
> 10-20 |
> 10-15 |
C |
> 20-35 |
> 15-25 |
D |
> 35-55 |
> 25-35 |
E |
> 55-80 |
> 35-50 |
F |
> 80 |
> 50 |
Source: Highway Capacity Manual 2010.
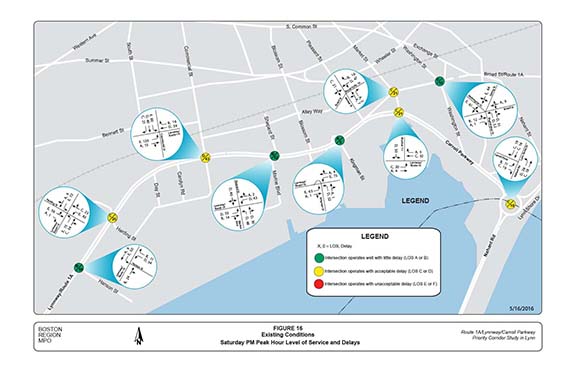
Figure 13 shows the existing lane configuration of the Lynnway and Carroll Parkway. Figures 14 through 16 show the results of the existing conditions analyses in terms of LOS and delays for the weekday AM, weekday PM and Saturday PM peak hours, respectively. The existing conditions LOS analysis worksheets are included in Appendix H. None of the intersections in the corridor appear to be failing. Delays and queues occur only during the peak periods at the following critical intersections, where the levels of service are still acceptable:
Based on analyzing the existing conditions, field reconnaissance, and task force discussions, the following problems were identified in the corridor.
Figures 17 and 18, and the issues listed below, show some of the problems and challenges facing pedestrians and bicyclists and the reasons why the roadway is considered unfriendly for pedestrians and bicycles:
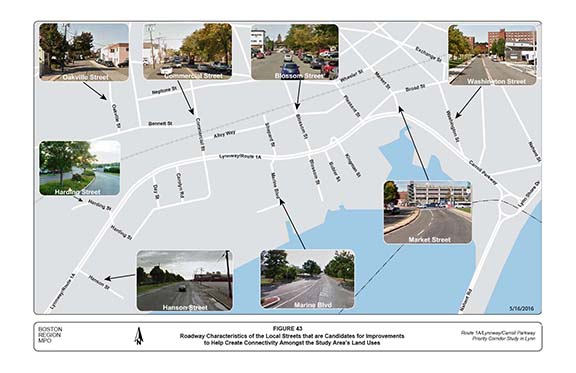
Developing the waterfront into a vibrant destination with direct linkage to Lynn's downtown and surrounding neighborhoods would require improvements to the Lynnway, Carroll Parkway and ancillary19 local streets that accommodate all road users. Plans for the waterfront include residential development; retail stores; boardwalk, entertainment and recreation areas; and office parks. Residents and visitors to the waterfront would walk, bicycle, or drive. Hence, the following access issues need to be addressed in order to realize the city’s vision for the waterfront.
Chapter 6—Short-Term Improvements
MPO staff worked with the study’s advisory task force to develop short-term strategies for addressing the safety, operations, and access issues identified in the corridor. The time frame categorized as “short-term” is typically less than five years. In addition, short-term improvements are less complicated to perform and require a smaller amount of funding, design and engineering.
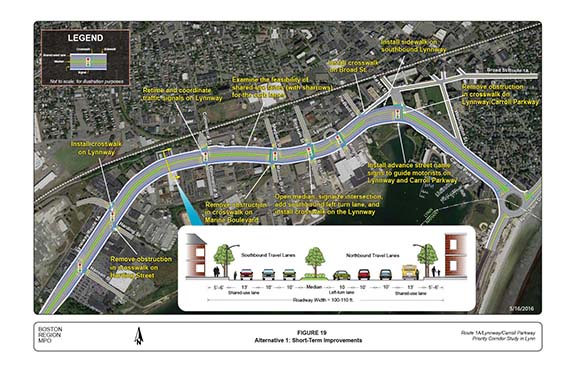
Alternative 1 maintains the existing roadway cross-section and makes short-term improvements that address some of the issues affecting pedestrian and bicycle safety, access to the Lynn Ferry terminal, and traffic flow. Figure 19 shows some possible short-term improvements, which are described in detail in the following two sections; Figure 20 also illustrates short-term improvements that will be discussed as they become relevant. All of the improvements described are low- and medium-cost and can be implemented within one-to-five years using either maintenance funds or special funds.
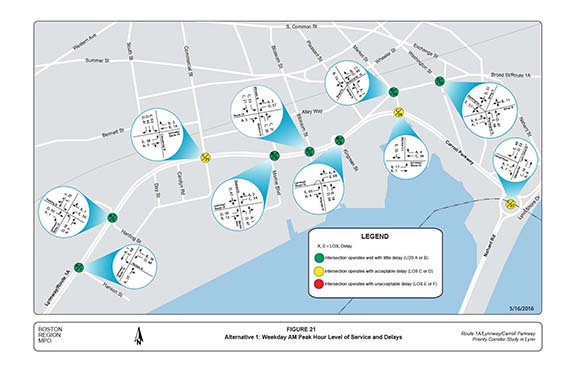
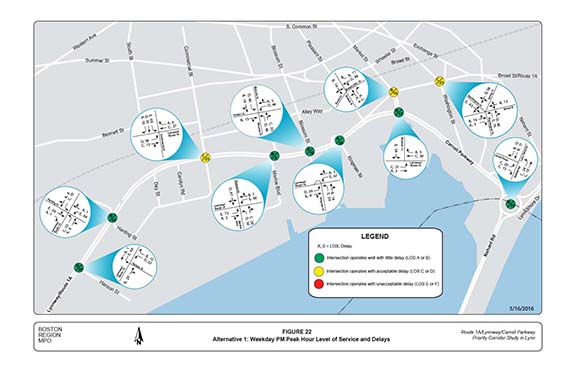
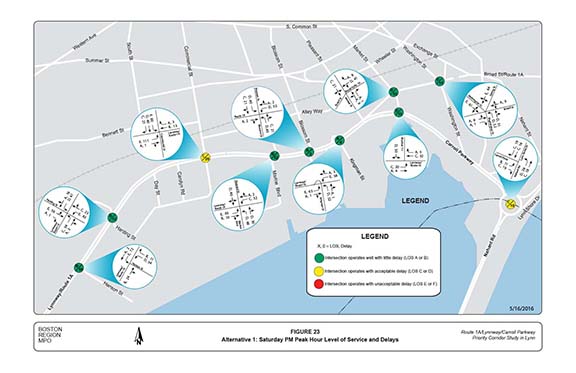
Figures 21 through 23 show the results of the LOS and delays analyses for the weekday AM and PM and Saturday PM peak hours. The results show that the Alternative 1 recommendations operate satisfactorily (LOS D or better for high-volume through traffic). The LOS analysis worksheets for Alternative 1 are included in Appendix I.
Alternative 1 has the following advantages:
Alternative 1 has the following disadvantages:
Based on the reconstruction costs of similar past projects in the MassDOT project information database, MPO staff estimate Alternative 1 to cost approximately $5-to-$7 million. This cost estimate includes the elements described above, such as a new traffic signal at the Blossom Street intersection, new signal coordination, installation of signal head backplates, and improved signage. It includes safety improvements for pedestrians and bicycles, such as adding countdown timers and shared-use curb lanes, repairing broken sidewalks, and making ADA improvements, including removing obstructions from crosswalks, adding detectable warning plates to the curb ramps, and installing accessible pedestrian signals.
Chapter 7—Long-Term Improvements
The time frame categorized as “long-term” is typically greater than five years and can be as long as 15 years. Long-term improvements are more complicated than their short-term counterparts are, and require more funding resources and design and engineering efforts. Because the waterfront area has been classified as a Commonwealth of Massachusetts Growth District and rezoned for commercial and residential development, the strategy for the Lynnway and Carroll Parkway renovations was to evaluate different roadway cross-sections to see what must be done in order to improve safety, operations, and access for all users to the waterfront, and to connect it with the downtown area and surrounding neighborhoods.
Based on discussions with the advisory task force, MPO staff have developed five long-term alternatives for consideration. Some of the alternatives have improvements that mostly fall within the existing roadway’s right-of-way width and take into account the needs of abutters and users (for example, Alternatives 2, 4, and 6). Other alternatives propose improvements that would require more space to build the improvements (such as Alternatives 3 and 5). All of the long-term alternatives would require the proposed land use changes at the waterfront area—for example, land uses that attract pedestrians and bicyclists, such as entertainment and recreation areas, residential and commercial developments, and office parks—in order to be successful.
For each of the long-term alternatives, staff recommend major landscape and streetscape improvements to make the Lynnway and Carroll Parkway more attractive to pedestrians and bicyclists, the aforementioned waterfront land use changes, and support improved connectivity from the waterfront to the Lynn downtown area and to the residential neighborhoods along the corridor.
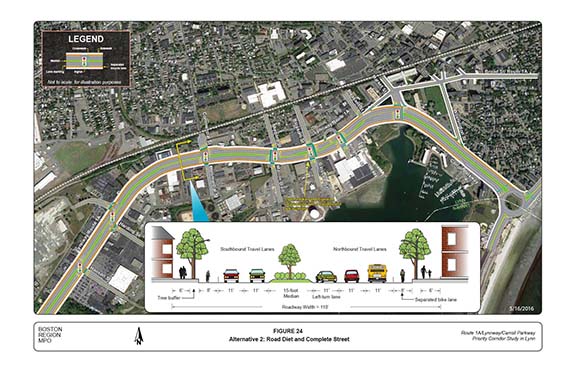
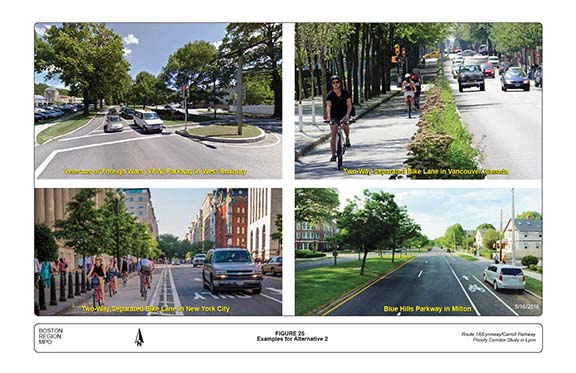
Alternative 2 would remove a travel lane in each direction on the Lynnway and Carroll Parkway and reconfigure the roadway to facilitate installation of a wider median (between 12 and 20 feet); wider sidewalks; shorter crosswalks with pedestrian refuge areas; and separated bicycle lanes; and introduce more landscaping and better streetscape design, as shown in Figure 24. The new streetscape would include bus shelters with benches, sidewalks with tree or grass buffers, and ornamental street lighting. Examples of model roadways would be the Veterans of Foreign War (VFW) Parkway in West Roxbury and the Blue Hills Parkway in Milton, both of which are shown in Figure 25, among other examples.
Alternative 2 promotes renovation of the corridor to make it easier to walk and bike to the waterfront. The separated bicycle lanes would provide greater protection and higher visibility for both bicyclists and motorists, improving safety for all road users. The bicycle lanes would support connections to the proposed Bike-to-the-Sea trail and proposed General Electric commuter rail station and encourage biking to the waterfront. Alternative 2 is multimodal and, in tandem with improved ancillary local streets, would fulfill the vision of connecting the waterfront to the Lynn downtown area, nearby neighborhoods, and the pertinent transportation service centers.
In addition to the renovation efforts discussed above, providing the following features would modernize the Lynnway and Carroll Parkway to increase safety and make the roadway efficient for all users:
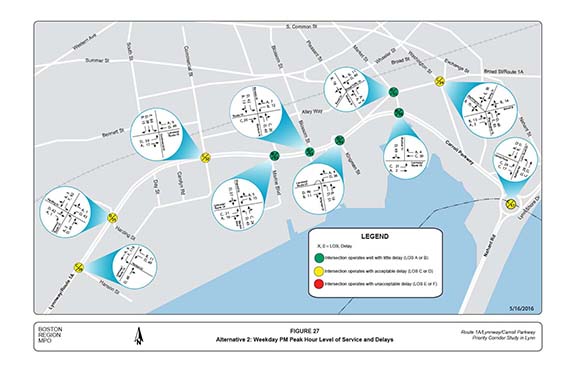
Figures 26 through 28 show the resulting performance of Alternative 2 in terms of LOS and delays for the weekday AM and PM and Saturday PM peak hours. Appendix J includes the LOS worksheets for this alternative. The analyses show that with signal coordination, protected-permitted left-turn treatments, and concurrent pedestrian phases, Alternative 2 would operate satisfactorily (LOS D or better for the high volume of through traffic).
Alternative 2 may reduce traffic volumes on the Lynnway and Carroll Parkway. Studies have shown that reducing roadway capacity to accommodate all users influences trip-making decisions, which eventually result in the following:
Alternative 2 has the following advantages:
Alternative 2 has the following disadvantages:
Based on the reconstruction costs of similar past projects recorded in the MassDOT project information database, MPO staff estimate Alternative 2 to cost approximately between $15-and-$20 million, excluding any land takings required for the improvement. This estimate includes drainage improvements, sidewalk and ADA-compliant ramp construction, landscape and streetscape renovation, paving, traffic signals and equipment upgrade, and street lighting.
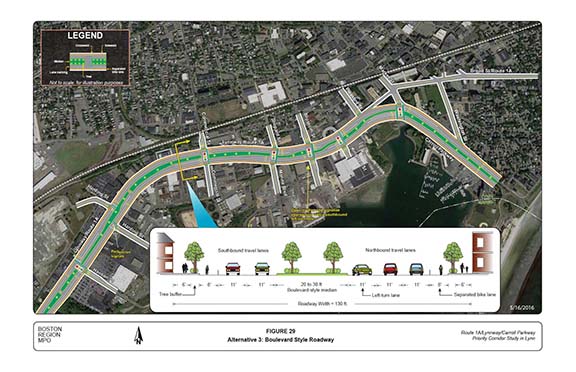
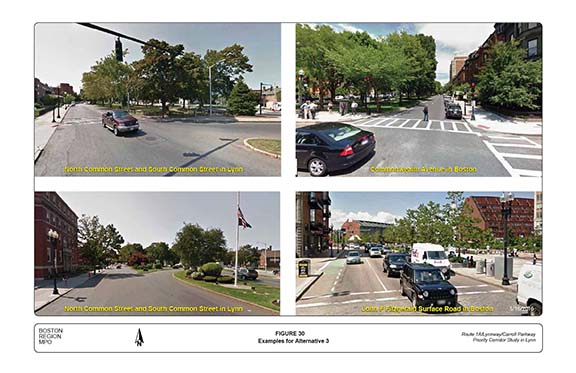
Alternative 3 would convert the Lynnway and Carroll Parkway into a boulevard-style roadway with a wider, planted median (20-to-30 feet wide), especially in the Lynnway segment. It would consist of two travel lanes and a separated bicycle lane in each direction (see Figure 29). The design includes wider sidewalks and new landscaping and streetscape design, including trees, bus shelters with benches, and ornamental lighting. Figure 30 gives examples from existing models of how Alternative 3 would look, such as North and South Common Streets in Lynn or a smaller-scale Commonwealth Avenue in Boston.
Alternative 3 promotes a renovation of the Lynnway and Carroll Parkway into a pedestrian- and bicycle-oriented boulevard while maintaining traffic flow. The wider median (compared to Alternative 2) would significantly soften the traffic-dominant environment that characterizes the Lynnway and attract more pedestrians and bicyclists to walk or bike to the waterfront. It would also make the daunting Lynnway far easier for pedestrians to cross. By transforming the Lynnway and Carroll Parkway into a boulevard, the roadway would become both a transportation corridor as well as a neighborhood amenity that supports livable communities and vibrant waterfront activities. With space for driving, walking, and bicycling, Alternative 3 would support multimodal connections to downtown Lynn, including the proposed Bike-to-the-Sea trail, the General Electric commuter rail station and transportation service centers such as Lynn Central Square Station and the Lynn Ferry terminal.
In addition to the landscape and streetscape and welcoming environment for pedestrians and bicyclists, providing the following operational features would increase safety and modernize the roadway to serve all users efficiently:
With signal coordination, protected-permitted left-turn treatments, and concurrent pedestrian phases, the expected performance of Alternative 3 in terms of LOS and delay for the weekday AM and PM and Saturday PM peak hours would be similar to those of Alternative 2: operates satisfactorily (LOS D of better for the high-volume through traffic). In addition, the reduction in traffic capacity possibly would reduce traffic volumes on the Lynnway and Carroll Parkway through peak-hour spreading and contribute to changes in mode of transportation from automobile to transit.
The following are the advantages of Alternative 3:
The following are the disadvantages of Alternative 3:
Based on the reconstruction costs of similar past projects archived in the MassDOT project information database, MPO staff estimate Alternative 3 to cost approximately $25-to-$30 million, excluding the land takings required for the improvements. This estimate includes drainage improvements, accommodation and relocation of utilities, sidewalk and ADA-compliant ramp construction, landscape and streetscape renovation, paving, traffic signals and equipment upgrade, and installation of street lighting.
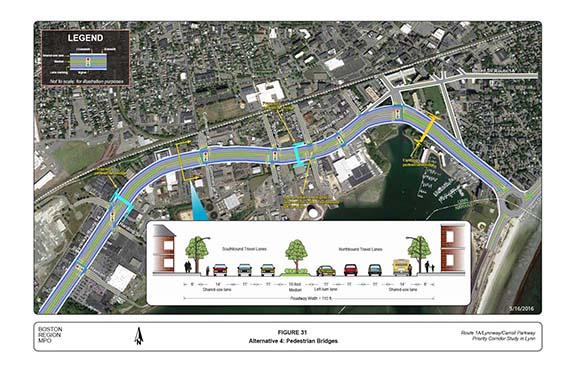
This alternative was added because pedestrian bridges were discussed during the advisory task force meetings. Pedestrian bridges over the Lynnway have been discussed in the community as a means to open West Lynn to the waterfront. Presently there is a pedestrian bridge over the Carroll Parkway connecting the North Shore Community College and the Lynn Heritage State Park. Two options were developed for Alternative 4.
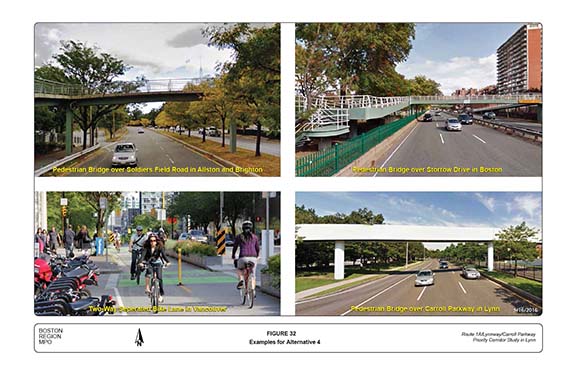
Alternative 4 would keep the existing roadway cross-section and add pedestrian bridges at selected locations for crossing the Lynnway to increase safety and mobility for pedestrians. Additional improvements include reducing lane widths to 10 feet from 11 feet in order to create a 13-foot curb lane in both directions for shared-use with bicyclists (Figure 31). MPO staff recommend pavement markings in the shared-use lanes (sharrows) to alert drivers to share the roadway and watch for bicyclists. New sidewalks with buffers, bus shelters with benches, and landscape and streetscape beautification are suggested in this alternative to provide a welcoming experience for pedestrians and bicyclists. Figure 32 gives examples models for Alternative 4, such as Soldiers Field Road in Allston and Brighton, Storrow Drive in Boston, or extending the Carroll Parkway roadway character to the Lynnway portion of the corridor.
Much like Alternative 2, Alternative 4 could also be reconfigured to reduce travel lanes to four lanes (two lanes in each direction) and add pedestrian bridges at selected locations for crossing the Lynnway and separated bicycle lanes in both directions.
In locating the pedestrian bridges, we must consider the land uses proposed for the waterfront and the desired connections amongst the Lynn downtown area, the waterfront’s surrounding neighborhoods, and the pertinent transportation centers. Candidate locations include the busy Commercial Street intersection; the Harding Street intersection, which lacks a crosswalk on the Lynnway; and the Blossom Street intersection, which would provide access to the Lynn Ferry terminal. These three options are discussed below.
In addition to the pedestrian bridges and bicycle lanes, incorporating the following operational features into Alternative 4 would help to modernize the Lynnway and Carroll Parkway, increase safety, and make traffic flow efficiently:
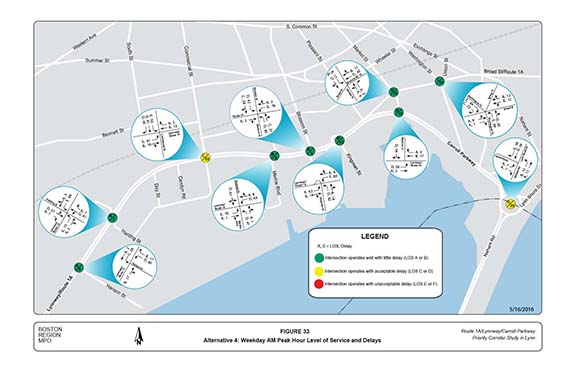
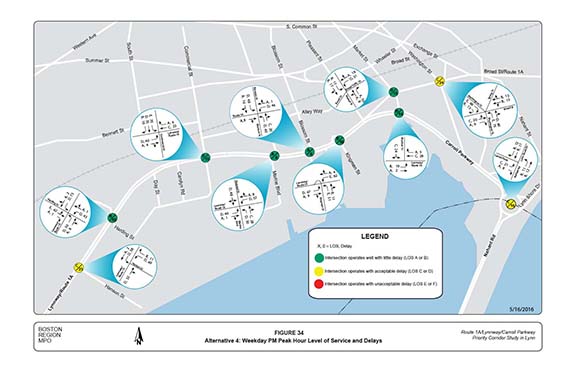
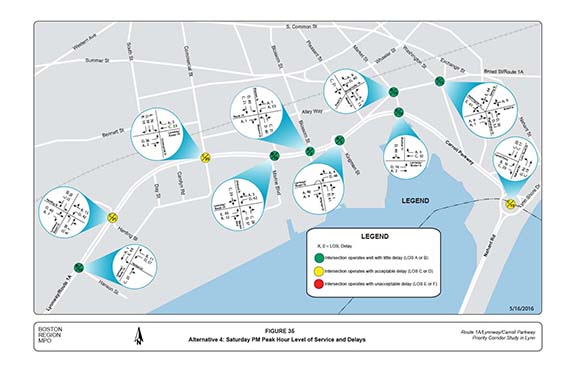
Figures 33 through 35 show the resulting performance of Alternative 4, Option 1, in terms of LOS and delays for the weekday AM and PM and Saturday PM peak hours. The analyses show that with signal coordination, protected left-turn treatments, and concurrent pedestrian phases, Alternative 4 would operate satisfactorily (LOS D or better for the high volume of through traffic).
With signal coordination, protected-permitted left-turn treatments, and concurrent pedestrian phases, the expected performance of Alternative 4, Option 2, in terms of LOS and delay for the would be similar to those of Alternative 2: operates satisfactorily (LOS D of better for the high-volume through traffic). The reduction in traffic capacity could reduce traffic volumes on the Lynnway and Carroll Parkway through peak-hour spreading and encourage changes in mode of transportation from automobile to transit.
The following are the advantages of Alternative 4:
The following are the disadvantages of Alternative 4:
Based on the reconstruction costs of similar past projects archived in the MassDOT project information database, MPO staff estimate Alternative 4 to cost approximately $20-to-$25 million, excluding the cost of the land takings required for the improvements. This estimate includes two ADA-compliant pedestrian bridges, drainage improvements, accommodation and relocation of utilities, sidewalk and ADA-compliant ramps, landscape and streetscape renovation, paving, traffic signals and equipment upgrade, and the installation of street lighting.
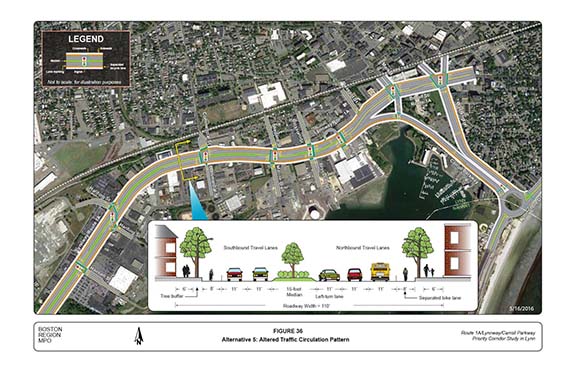
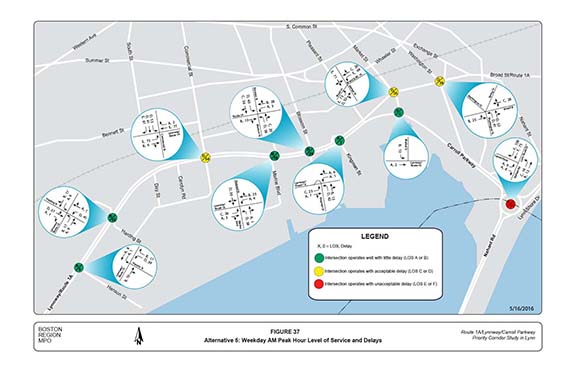
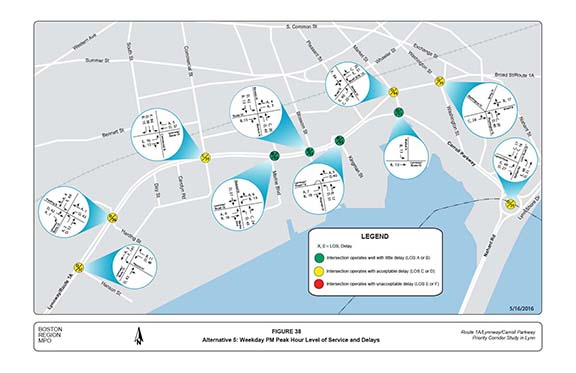
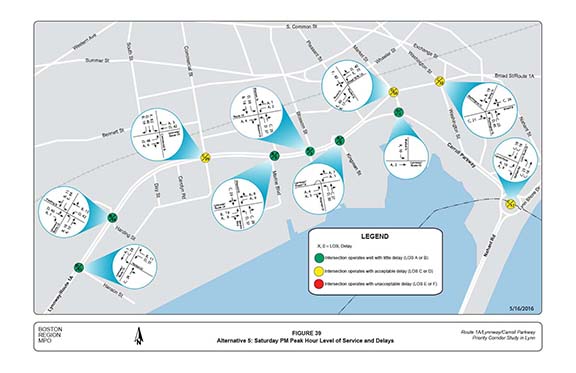
Alternative 5 was suggested in the Lynn Waterfront Master Plan prepared by Sasaki Associates.26 This alternative is comparable to Alternative 2 except that the traffic circulation pattern is altered on the Lynnway and Carroll Parkway close to the downtown area and North Shore Community College area, as shown in Figure 36. The high volume of traffic on the Lynnway and the split between the Carroll Parkway and Route 1A creates a traffic queue from the Market Street and Broad Street intersection toward the Lynnway. This alternative eliminates the problem by splitting the traffic going between the Lynnway and Lynn Shore Drive, with northbound traffic staying on the water side of North Shore Community College and southbound traffic shifting to the land side, via Washington Street and Broad Street. Another purpose of this alternative is that splitting the roadway into one-way traffic circulation would make it easier for pedestrians to cross the roadway to the waterfront. MPO staff analyzed this alternative in order to provide more information for stakeholders’ decision making. As with the other alternatives, the design would include new sidewalks, landscape and streetscape renovation with trees and plants, and bus shelters with benches to provide a welcoming experience for motorists, pedestrians, and bicyclists. Examples for Alternative 5 from existing roadways are similar to those of Alternative 2: Veterans of Foreign War (VFW) Parkway in West Roxbury and Blue Hills Parkway in Milton, both of which are shown in Figure 25.
The following operational features should be incorporated into Alternative 5 to increase safety and modernize roadway efficiency:
Figures 37 through 39 show the performance of Alternative 5 in terms of LOS and delay for the weekday AM and PM and Saturday PM peak hours. The analyses indicate that this alternative would increase traffic congestion in the downtown area because of the high-volume AM peak-period traffic that would be rerouted to Washington Street and Broad Street. Appendix L includes the LOS worksheets for this alternative.
The following are the advantages of Alternative 5:
The following are the disadvantages of Alternative 5:
Based on the reconstruction costs of similar past projects archived in the MassDOT project information database, MPO staff estimate Alternative 5 to cost approximately $15-to-$20 million, excluding the land takings required for the improvements. This estimate includes roadway reconstruction, drainage improvements, the accommodation and relocation of utilities, sidewalk- and ADA-compliant ramp construction, landscape and streetscape renovation, paving, traffic signals and equipment upgrade, and the installation street lighting.
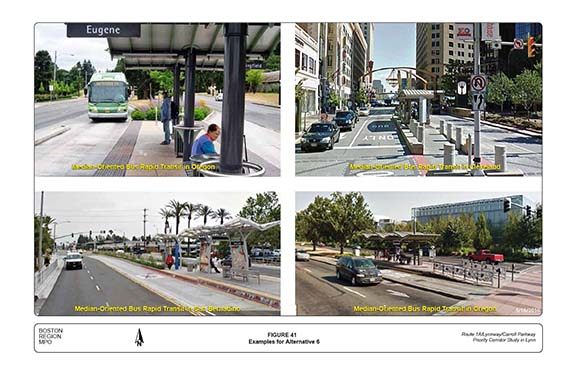
There are six bus routes on the Lynnway serving Lynn and the surrounding communities, with total average daily ridership of 6,000 passengers or more. The service connects passengers to transportation centers such as Lynn’s Central Square, Wonderland Station, and Downtown Boston. The bus service meets on-time performance or schedule adherence only 50 percent of the time because of traffic congestion and interruptions. Median-oriented BRT lanes would improve bus service performance, as such lanes effectively avoid the interruptions caused by traffic access, egress from business driveways or right turn onto side streets. Exclusive bus lanes and a transit signal priority for BRT systems would reduce traffic delays and improve on-time performance.
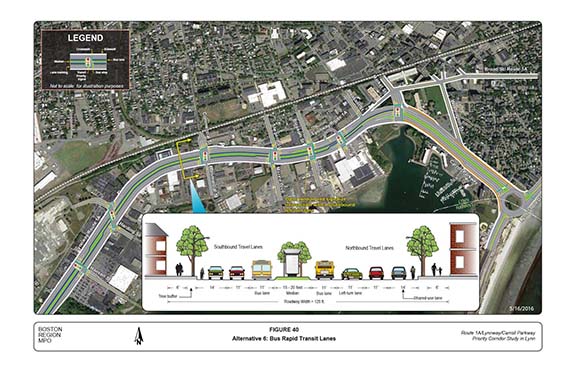
Alternative 6 keeps the existing roadway cross-section and converts the lanes close to the median into median-oriented BRT lanes (see Figure 40). The alternative would provide two lanes in each direction of the Lynnway and Carroll Parkway for general-purpose traffic and left-turn lanes at selected locations for the traffic accessing driveways and side streets. Additional improvements include widened curb lanes (about 14 feet) for shared use with bicycles or widened shoulders (about 4 feet) for use by bicyclists. Figure 41 shows examples of roadways with BRT facilities.
Additional improvements included in Alternative 6 to increase safety and modernize the roadway’s efficiency are:
The performance of Alternative 6 in terms of LOS and delay for the weekday AM and PM and Saturday PM peak hours would be similar to Alternative 2: operates satisfactorily at LOS D or better for the high volume of through traffic.
The following are some of the benefits of Alternative 6:
Based on the reconstruction costs of similar past projects archived in the MassDOT project information database, MPO staff estimate Alternative 6 to cost approximately $25-to-$30 million, excluding the cost of any land takings or new buses. This estimate includes drainage improvements, the accommodation and relocation of utilities, sidewalk and ADA-compliant ramp construction, bus shelters and benches, landscape and streetscape renovation, paving, new traffic and transit priority signals, equipment upgrade, and installation of street lighting.
Table 5 presents the peak-hour arterial performance measures for each alternative. The arterial performance measure contains information about the LOS and speeds for the principal arterial streets: Lynnway and Carroll Parkway. The analyses indicate that for each alternative, the arterial streets would operate at LOS D or better. Table 6 presents the peak-hour network performance measures for the alternatives. The network performance measures contain information about total delay, average travel speed, and total travel time for the street network, including the side streets. The analyses indicate higher delays for Alternative 5 compared to the remainder of the alternatives.
TABLE 5
Arterial Performance Measures
-- |
-- |
Speed |
LOS |
Speed |
LOS |
Speed |
LOS |
Speed |
LOS |
Speed |
LOS |
Speed |
LOS |
-- |
-- |
NB |
NB |
NB |
NB |
NB |
NB |
SB |
SB |
SB |
SB |
SB |
SB |
Alternative |
Year |
AM |
AM |
PM |
PM |
SAT |
SAT |
AM |
AM |
PM |
PM |
SAT |
SAT |
Existing Conditions |
2015 |
24.4 |
B |
22.5 |
C |
19.8 |
C |
21.9 |
C |
21.6 |
C |
22.1 |
C |
Alternative 1 |
2015 |
24.5 |
B |
22.8 |
C |
24.2 |
B |
25.7 |
B |
23.9 |
C |
24.5 |
B |
Alternative 1 |
2040 |
23.3 |
C |
22.1 |
C |
22.7 |
C |
24.2 |
B |
23.2 |
C |
20.6 |
C |
Alternatives 2, 3, and 6 |
2040 |
23.3 |
C |
16.9 |
D |
21.6 |
C |
19.3 |
C |
20.4 |
C |
19.3 |
C |
Alternative 4 |
2040 |
23.3 |
C |
22.1 |
C |
22.7 |
C |
24.2 |
B |
23.2 |
C |
20.6 |
C |
Alternative 5 |
2040 |
23.1 |
C |
16.4 |
D |
22.9 |
C |
15.5 |
D |
21.3 |
C |
20.6 |
C |
AM = ante meridiem (before noon). LOS = level-of-service rating. NB = northbound. PM = post meridiem (after noon). SAT = Saturday. SB = Southbound.
Source: Central Transportation Planning Staff.
TABLE 6
Network Performance Measures
-- |
-- |
Total Delay (hr) |
Total Delay (hr) |
Total Delay (hr) |
Average Speed (mph) |
Average Speed (mph) |
Average Speed (mph) |
Total Travel Time (hr) |
Total Travel Time (hr) |
Total Travel Time (hr) |
Alternative |
Year |
AM |
PM |
SAT |
AM |
PM |
SAT |
AM |
PM |
SAT |
Existing Conditions |
2015 |
117 |
134 |
148 |
22 |
22 |
20 |
312 |
350 |
349 |
Alternative 1 |
2015 |
97 |
118 |
113 |
23 |
23 |
22 |
293 |
335 |
314 |
Alternative 1 |
2040 |
104 |
124 |
124 |
23 |
22 |
22 |
307 |
344 |
331 |
Alternatives 2, 3, and 6 |
2040 |
128 |
198 |
143 |
21 |
19 |
21 |
327 |
431 |
348 |
Alternative 4 |
2040 |
104 |
124 |
124 |
23 |
22 |
22 |
307 |
344 |
331 |
Alternative 5 |
2040 |
226 |
223 |
146 |
17 |
18 |
21 |
445 |
462 |
366 |
AM = ante meridiem (before noon). PM = post meridiem (after noon). SAT = Saturday.
Source: Central Transportation Planning Staff.
Table 7 summarizes how each of the alternatives accomplishes the goals and objectives of the study. The evaluation criteria are intended to provide qualitative and quantitative measures of the alternatives, providing insight into how the alternatives compare or relate to one another. The goals and objectives are:
TABLE 7
Summary of Alternatives Analyses
|
Goals and Objectives |
Alternative 1 |
Alternative 2 |
Alternative 3 |
Alternative 4 |
Alternative 5 |
Alternative 6 |
|---|---|---|---|---|---|---|
Supports Lynn’s vision for the waterfront |
No benefit |
Significant benefit |
Significant benefit |
Significant benefit |
Significant benefit |
Significant benefit |
Promotes healthy transportation |
No benefit |
Significant benefit |
Significant benefit |
Significant benefit |
Significant benefit |
Significant benefit |
Increases safety for all road users |
Moderate benefit |
Significant benefit |
Significant benefit |
Significant benefit |
Significant benefit |
Significant benefit |
Makes traffic flow efficiently |
Moderate benefit |
Moderate benefit |
Moderate benefit |
Significant benefit |
No benefit |
Moderate benefit |
Promotes multimodal transportation |
Moderate benefit |
Significant benefit |
Significant benefit |
Moderate benefit |
Significant benefit |
Significant benefit |
Makes transit service more efficient |
No benefit |
Moderate benefit |
Moderate benefit |
Moderate benefit |
Moderate benefit |
Significant benefit |
Promotes land use and economic and cultural activities |
No benefit |
Significant benefit |
Significant benefit |
Moderate benefit |
Significant benefit |
Significant benefit |
Potential property impacts |
None |
Moderate |
Significant |
Moderate |
Moderate |
Significant |
Associated construct cost* |
Low |
Moderate |
High |
Moderate |
Moderate |
High |
*Associated construction costs for those alternatives, which require an expansion of the right-of-way, as land takings will add to the total cost but are not accounted for in the study.
Source: Central Transportation Planning Staff.
The primary factors for selecting the preferred long-term alternatives are cost and effectiveness in meeting the goals and objectives described above. The one short-term alternative we have offered would not support many of the study’s goals and objectives, but it addresses immediate safety and operations concerns, such ADA concerns, safety for pedestrians, traffic operations issues, and access to the Lynn ferry terminal.
Generally, all of the long-term alternatives meet the goals and objectives of the study, which, overall, aim to support Lynn’s vision for the waterfront development. With improved local street connectivity, the long-term alternatives would facilitate linkage between the waterfront and Lynn’s downtown area and surrounding neighborhoods. In addition, they are expected to improve safety for all users and promote healthy transportation modes: the proposed sidewalks with buffers, separated bicycle lanes, pedestrian bridges, and median refuge areas for pedestrians would not only increase safety for users but also create a pedestrian- and bicyclist-friendly roadway and encourage walking and bicycling.
Furthermore, the traffic analyses indicate that the long-term alternatives would function well while not contributing significantly to traffic congestion (except for Alternative 5 in the downtown area), and would balance regional traffic needs with pedestrian and bicycle needs and support vibrant waterfront economic activities. Again, with improved local street connectivity, all of the alternatives would allow direct and safe public access to the Lynn ferry terminal, the proposed GE commuter rail station, and Lynn Central Square Station. However, Alternative 6 provides the most effective improvements to bus transit service in the corridor to support the economic activities of the waterfront.
An essential step to fully implementing the city’s vision for the waterfront is to improve the connectivity from the Lynnway and Carroll Parkway to foster the cohesion of the abutting land uses, connect people to places, and promote economic activities. Among the activity locations where direct public access from the Lynnway and Carroll Parkway would promote connectivity are:
Several minor arterials and collector roadways that intersect the Lynnway have the ability to facilitate public access and connectivity from the waterfront to Lynn’s downtown area, surrounding neighborhoods, and transportation centers. However, they would need improvements in order to meet Complete Streets standards and support multimodal transportation. Figure 42 shows the land uses surrounding the Lynnway and Carroll Parkway and the streets with potential to facilitate connectivity among the land uses. Figure 43 shows the roadway characteristics of those streets. The following are brief descriptions of the problems at each location and the improvements needed to make those streets capable of supporting connectivity among the different land uses in the study area.
Although it presently carries very little traffic, Harding Street is a potential access road for waterfront residents and visitors to the proposed General Electric commuter rail station. It would need an extension and reconstruction to provide a welcoming experience for pedestrian and bicyclists, such as the inclusion of sidewalks, high-visibility crosswalks, street lighting, and bicycle lanes. MPO staff noted in Alternative 4 that the intersection of Harding Street and the Lynnway is a potential candidate for a pedestrian bridge, which would make it easier to walk or bike to the waterfront or commuter rail station from the other side of the corridor.
MPO staff recommend extending Oakville Street to connect to the Lynnway and the waterfront. The extension would benefit the surrounding neighborhood and waterfront residents and visitors because Oakville Street connects to Western Avenue (Route 107) via Summer Street. Although the extension would require new roadway construction, a bridge over the MBTA Newburyport/Rockport commuter rail line, and a new intersection on the Lynnway, it is expected to reduce the high volume of traffic on Commercial Street and prevent future widening of that roadway. While the extension would require land takings to construct, it presents an opportunity to modernize Oakville Street to accommodate pedestrians and bicyclists with good a sidewalk experience and bike lanes or shared-use lanes to connect to the waterfront.
This is one of the busiest streets connecting with the Lynnway and provides access to the waterfront, Lynn Common and the surrounding neighborhood, and Western Avenue via Summer Street. The intersection of Commercial Street and the Lynnway is busy, with high volumes of traffic that conflict with pedestrian and bicycle movements. The intersection has long crosswalks, which intimidate many pedestrians and bicyclists. Commercial Street needs improvements to provide a welcoming environment for pedestrians and bicyclists, such as good sidewalks and shoulders, or sharrows or bike lanes. In addition, the intersection of Commercial Street and the Lynnway is a potential candidate for a pedestrian bridge; it would make it easier to walk or bike to the waterfront or the surrounding neighborhoods by separating pedestrian and vehicular traffic at the intersection.
Blossom Street provides access to the Waterfront, the Lynn ferry terminal, Lynn Common and surrounding neighborhood and Lynn’s downtown. Opening the raised median and signalizing the intersection to provide safe turns would provide direct access to the ferry terminal for thousands of commuters and for waterfront residents and visitors. Besides the improvements needed at its intersection with the Lynnway to make it easier for pedestrians and bicyclists to cross the streets, Blossom Street also needs improvements along the segment to balance traffic needs with pedestrian and bicycle needs, including sidewalk repairs, shoulders or shared-use lanes or bike lanes, street lights, high-visibility crosswalks, and signage.
Pleasant Street connects to the Lynnway and provides access to the Lynn Common and surrounding neighborhood. St Mary’s Parish and High School, Shaw’s Supermarket, and many small retail stores and offices are located on Pleasant Street. Pleasant Street has sidewalks on both sides of the street but would need improvements to give pedestrians a welcome experience and to better accommodate bicyclists, such as high-visibility crosswalks and shared-use lanes.
Market Street is the main entry to Lynn’s downtown area and North Shore Community College and in the future could connect to a vibrant waterfront. Market Street is about one half-mile long and is configured to serve downtown businesses and activities: it has two travel lanes in each direction, sidewalks and on-street parking on both sides of the street, and six signalized intersections. Market Street lacks gateway status and is not bicycle-friendly. In order to become a gateway to the city, it would need reconstruction to beautify it, with median landscape and streetscape treatments, and multimodal renovations to help it balance vehicular needs with pedestrian and bicyclist needs and link it to the waterfront development, North Shore Community College, and the Lynn Heritage State Park, thereby providing cohesion amongst the land uses.
Washington Street connects to the North Shore Community College, Sagamore Hill neighborhood, and Lynn’s downtown area. It is a two-lane, two-way roadway, with a much lower volume of traffic compared to Market Street. It has sidewalks and on-street parking on both sides. Much like Market Street, the Washington Street corridor lacks gateway status and does not provide a comfortable experience for pedestrians and bicyclists. In 2008, the city developed a masterplan for the corridor.27 Similar to that of the waterfront development, the city envisions the development of a mix of land uses, including retail, residential, and office spaces, in order to create vitality, increase real estate investment, and maximize development in the corridor. To implement this vision, as well as the vision for the waterfront, this corridor would need access and beautification improvements to create a friendly environment for pedestrians and bicyclists and promote connections between Sagamore Hill, North Shore Community College, Lynn’s downtown area, and the waterfront.
Chapter 9—Conclusion and Next Steps
This study identified the transportation needs of the Lynnway and Carroll Parkway, which include safety, operations, and mobility. MPO staff, working with the study’s advisory task force, has developed short- and long-term alternatives that would transform the Lynnway and Carroll Parkway into a pedestrian- and bicyclist-friendly roadway as well as into a transportation corridor that serves all modes of transportation and maintains regional travel capacity. MPO staff evaluated different roadway cross-sections to accommodate all road users safely and fulfill Lynn’s vision for the waterfront, including improved connectivity from the Lynnway and Carroll Parkway to Lynn’s downtown area, surrounding neighborhoods and the waterfront itself, thereby fostering cohesion among the abutting land uses, connecting people and their destinations, and promoting economic activity.
This study provides the City of Lynn, DCR, MassDOT, and other stakeholders with an opportunity to begin researching the needs of the Lynnway and Carroll Parkway in light of the city’s vision for the waterfront, and to start planning their design and engineering efforts. The next step is to select alternatives that are sensitive to the goals and needs of stakeholders and then advance them through the planning process. DCR currently owns both the Lynnway and Carroll Parkway and is responsible for implementing any short- and long-term recommendations. The City of Lynn owns the minor arterials and the local collectors that connect to the Lynnway and Carroll Parkway and is responsible for renovating those streets to enhance their connectivity. Therefore, it is important for the City of Lynn and DCR to examine the design of the long-term alternatives with everyone involved in mind: participation in this process by other stakeholders is important as well.
This study aligns with the MPO goals of modernizing roadways to reduce congestion, increasing safety on the region’s highway system, expanding the quantity and quality of walking and bicycling, and making transit service more efficient and modern. It also addresses Lynn’s goal of making the Lynnway and Carroll Parkway a more bicycle- and pedestrian-friendly roadway, conforming to its vision for the waterfront and for the cohesion of the abutting land uses. Any of the long-term alternatives this report offers, if implemented, would increase traffic safety, make traffic operations more efficient, and modernize the roadway to accommodate all users.
Transportation decision making is complex, and is influenced by factors such as financial limitations and agency programmatic commitments. Project development is the process that takes a transportation improvement from concept to construction. Appendix M includes an overview of the project development process.
SA/sa
1 Charting Progress to 2040, the Long-Range Transportation Plan of the Boston Region Metropolitan Planning Organization, approved by the Boston Region Metropolitan Planning Organization on July 30, 2015.
2 Transportation Improvement Program and Air Quality Conformity Determination, Federal Fiscal Years 2016–20, endorsed by the Boston Region Metropolitan Planning Organization on July 30, 2015.
3 Safety Conditions: Location has a higher-than-average crash rate for its functional class, contains a Highway Safety Improvement Program (HSIP)-eligible crash cluster, contains a top-200 high crash location, or has a significant number of pedestrian and bicycle crashes (two or more per mile).
4Congested Conditions: Travel time index is at least 1.3.
5 Multimodal Significance: Location carries bus route(s), is adjacent to a transit stop or station; supports bicycle or pedestrian activities or has an implementation project to support one or more of these activities; has need to accommodate pedestrians and bicyclists and improve transit; or high truck traffic serving regional commerce.
6 Regional Significance: Location is in National Highway System; carries a significant portion of regional traffic (ADT >20,000); lies within 0.5 miles of EJ transportation analysis areas or zones; or is essential for the region’s economic, cultural, or recreational development.
7 Reginal Equity: That is, it was important not to select 1) more than one location in a subregion and 2) a location in same subregion as in the preceding cycle of this study.
8 Implementation Potential: Location is proposed or endorsed by its roadway administrative agency (agencies); proposed or endorsed by its subregion and is a priority for that subregion; or has strong support from other stakeholders.
9 Sasaki Associates in collaboration with ZHA and GEI, Lynn Waterfront Master Plan Report, September 2007.
10 Ibid.
11 The Healthy Transportation Compact is a key requirement of the landmark transportation reform legislation signed into law in June 2009, to facilitate transportation decisions that balance the needs of all transportation users, expand mobility, improve public health, support a cleaner environment and create stronger communities.
12 Published by MassDOT based on crash information queried on August 13, 2014.
13 Published by MassDOT based on crash information queried on January 23, 2013.
14 "Equivalent property damage only" is a method of combining the number of crashes with the severity of crashes based on a weighted scale where a fatal crash is worth 10, an injury crash is worth 5, and a property-damage-only crash is worth 1.
15Staff did not prepare diagrams for a few crash reports because they lacked police-drawn sketches showing how they occurred, and so those reports are not included in Figures 5 through 9.
16 Highway Capacity Manual 2010, Transportation Research Board of the National Academies, Washington, DC, December 2010.
17 Trafficware Inc., Synchro Studio 8, Synchro plus SimTraffic, Build 801, Version 563, Sugar Land, Texas.
18 “Desire line” refers to a path worn into the ground by pedestrians who repeatedly take the same shortcut to get from one area to another.
19 Ancillary streets are major side streets.
20 “Curb extensions (also called bulb-outs) extend or widen the sidewalk into the parking lane to narrow the roadway and provide additional pedestrian space at key locations; they can be used at corners and at mid-block. Curb extensions enhance pedestrian safety by increasing pedestrian visibility, shortening crossing distances, slowing turning vehicles, and visually narrowing the roadway.” (Source: http://www.sfbetterstreets.org/find-project-types/pedestrian-safety-and-traffic-calming/traffic-calming-overview/curb-extensions/)
21 Bike-to-the-Sea trail is a multiuse path, free of cars, from the Malden/Everett area of Massachusetts to the beaches in Revere, Lynn and Nahant. It is still in construction and the section in Lynn has not been built.
22 New York City Department of Transportation, Prospect Park West: Bicycle Path and Traffic Calming Update, Retrieved from http://www.nyc.gov/html/dot/downloads/pdf/ 2012_ppw_trb2012 .pdf.
23 Parks J., Ryus P., Tanaka A., Monsere C., McNeil M., Dill J., Schultheiss W., District Department of Transportation Bicycle Facility Evaluation, Project No. 11404, (2012). Retrieved from http://ddot.dc.gov/node/477212.
24 Ibid.
25 Crash Modification Factors Clearinghouse, U.S. Department of Transportation, Federal Highway Administration, http://www.cmfclearinghouse.org/index.cfm.
26 Sasaki Associates, Inc., in collaboration with ZHA and GEI, Lynn Waterfront Master Plan Report, prepared for the City of Lynn, September 2007.
27 Washington Street Gateway District Plan, Sasaki Associates, Inc., April 2008.