MEMORANDUM
DATE October 18, 2012
TO Boston Region Metropolitan Planning Organization
FROM Mark S. Abbott, Senior Transportation Planner
MPO Staff
RE TIP Project Impacts Before-After Evaluation
This pilot study evaluated the effectiveness of selected TIP projects. Measuring project effectiveness is important in order to know whether the employed strategies work well and are, therefore, suitable for application in similar situations. It is also required by federal regulation as part of the mandatory Congestion Management Process (CMP).
To this end, four intersection locations were selected from TIP projects that were constructed in federal fiscal years 2008 and 2009. This allowed users at the project location to become familiar with the operations and for user demand to normalize in the area. The “before” data and relevant measures of effectiveness were gathered from existing functional design reports (FDRs) and traffic studies. The “after” data were collected by MPO staff.
This memorandum summarizes the “Before” and “After” safety and operation conditions at four intersection locations from two Transportation Improvement Program (TIP) projects funded by the Boston Region MPO. The project locations were in Arlington— FDR “Route 2A – Summer Street Roadway Reconstruction Project, Arlington, MA”—and Westwood—FDR “High Street (Route 109) Improvements, Gay Street to Summer Street.” The four intersections are:
These projects were selected from MassDOT’s Project Information website. 2 The following steps were used to select the projects.
The following measures of effectiveness (MOEs) were used in evaluating each project:
The information for the Arlington corridor and intersections was extracted from the FDR “Route 2A – Summer Street Roadway Reconstruction Project, Arlington, MA,” completed in February of 2000 by Fay, Spofford & Thorndike Inc.
The Arlington project consisted of the reconstruction of a section of Summer Street (Route 2A) from just west of Park Avenue Extension to just east of the Brattle Street/Hemlock Street intersection. The work consisted of reconstructing the roadway, constructing sidewalks, and upgrading the existing drainage, traffic signals, traffic signs, and markings. The construction began in the spring of 2004 and was completed in the spring of 2009. The cost of the project was estimated at $3,833,928, and the actual construction contract cost was $5,622,070. MBTA bus Route 67 runs along this section of Summer Street; through the intersections of Summer Street/Forest Street South and Summer Street with Brattle and Hemlock streets.
The information for the Westwood corridor and intersection was extracted from the FDR “High Street (Route 109) Improvements, Gay Street to Summer Street,” completed in July of 1996 by Greenman-Pederson Inc.
The Westwood intersection of High Street (Route 109) at Barlow Lane/Westwood Glen Road was also part of a corridor project that consisted of reconstructing High Street from Gay Street through Summer Street. The estimated cost of this project was $4,349,928, and the actual construction contract cost was $4,440,082. Construction was not started until the winter of 2004–05. The project was completed in the spring of 2008.
The intersection of Park Avenue Extension at Summer Street is a four-way signalized intersection, with Summer Street running east-west. In the vicinity of the intersection, Summer Street is an urban minor arterial. The Pierce Elementary School is located immediately south of the intersection, along Park Avenue Extension. The other surrounding land use is single-family residential.
The following sections provide a summary of the before-and-after conditions, along with a comparison of the crash data and traffic volumes, and a traffic analysis.
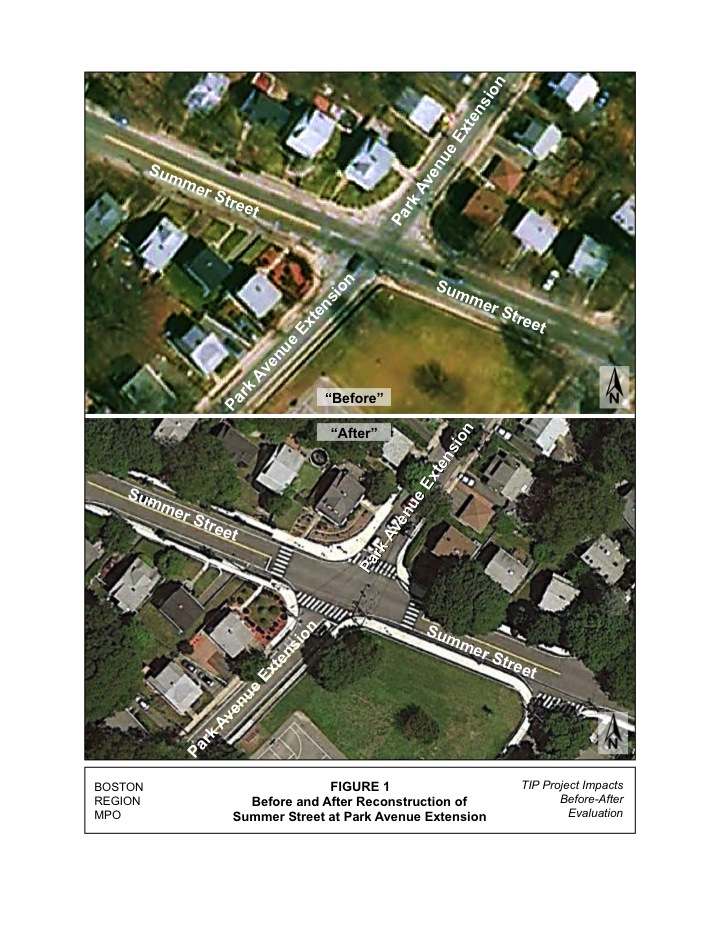
This four-way intersection was controlled by post-mounted signal heads with pedestrian signals provided on all approaches. As shown in Figure 1, the crosswalks were not clearly laid out and not well situated considering the close proximity to an elementary school and the fact that it is in a residential area. The Summer Street lane widths were 11.5 feet, with 3-foot shoulders. The existing sidewalks were 5 feet in width. The Park Avenue Extension lanes were also 11.5 feet in width, with 1-foot shoulders. The sidewalks along Park Avenue Extension were also 5 feet in width.
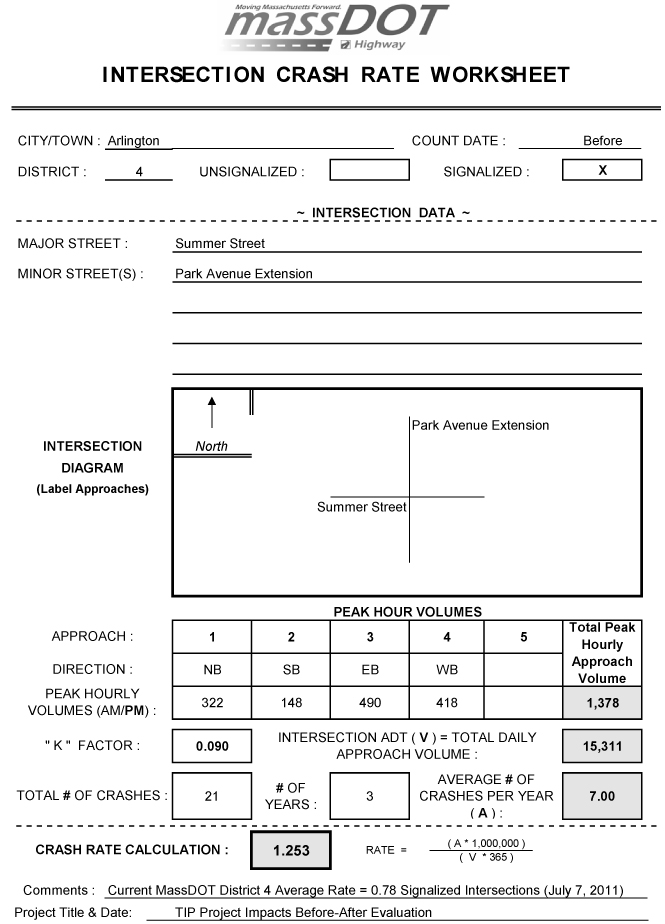
The crash rate before the reconstruction of the intersection was 1.25 crashes per million entering vehicles, which was well above the District 4 average of 0.78 for signalized intersections. According to the FDR’s crash analysis section, Summer Street motorists had difficulty seeing the traffic signals, which led to the high crash rate.
Figure 1 -- Before and After Reconstruction of Summer Street at Park Avenue Extension
Shows the Summer Street at Park Avenue Extension intersection before and after the reconstruction of the intersection.
The traffic operations were not a problem, with the intersection operating at level of service (LOS) B during both the AM and PM peak hours.
Therefore, it was necessary to reconstruct the intersection because of safety-related problems that was caused by the poor signal head visibility.
The intersection was reconstructed to improve both traffic and pedestrian safety. The Summer Street approach lanes were widened to 12-foot lanes, with 4-foot shoulders. The sidewalks were also widened, to 8.5 feet from the previous 5-foot-wide sidewalks. On the Park Avenue Extension approaches, the lane widths remained the same, 11.5 feet. Also, as shown in Figure 1, in the “After” condition, the crosswalks are clearly defined.
The signal visibility was improved by installing mast arms. For the Summer Street approaches, a single mast arm was installed, in the southeast corner. For the eastbound approach, two signal heads mounted on this mast arm are clearly visible. The westbound approach also has two signal heads mounted on this mast arm. A third signal is mounted on the post of another mast arm, located in the northeast corner, which provides two signal heads for the northbound approach. A third signal head is post-mounted on the northwest corner. The third mast arm is located in the southwest corner. Two signal heads are mounted on this mast arm for the southbound approach. A third signal head for this approach is mounted on the mast arm on the southeast corner. Pedestrian heads and buttons are found on all four corners of the intersection, and an exclusive pedestrian phase is provided.
The crash rate for the years 2005 to 2009 is 0.41, which is approximately a third of the rate of crashes that were occurring before the reconstruction. It is obvious that the improved visibility of the signal heads resulting from mounting them on mast arms has improved the safety of the intersection.
An analysis of the current traffic operations at the intersection indicate that it is operating as it was proposed, at LOS C during both peak hours.
Crash data from the FDR were compared to current MassDOT Registry of Motor Vehicles Division data for the most recent five years available, 2005 to 2009. Table 1 provides a summary of this comparison.
A total of 21 crashes occurred during the three years reported in the FDR, averaging 7 crashes per year. During the five recent years of data, from 2005 to 2009, there were 12 crashes, averaging 2.4 crashes per year.
Crash rate is another effective tool for examining the relative safety of a particular location. 3 Based on the 1995 to 1997 FDR crash data and the recently available MassDOT data from 2005 to 2009, the crash rate was 1.25 crashes per million entering vehicles for the earlier period (the FDR data) and 0.41 crashes per million entering vehicles for 2005 to 2009. The District 4 average for signalized intersections is 0.78 crashes per million entering vehicles. The crash rate calculation form is included in Appendix B.
Table 1
Crash Data Comparison: FDR (1995–97) to MassDOT (2005–09)
|
FDR 1995 to 1997 |
MassDOT 2005 to 2009 |
||||||||
Intersection |
1995 |
1996 |
1997 |
Crash Rate |
2005 |
2006 |
2007 |
2008 |
2009 |
Crash Rate |
Park Avenue Ext. at Summer Street |
8 |
8 |
5 |
1.25 |
0 |
5 |
2 |
0 |
5 |
0.41 |
MPO staff collected turning-movement counts at the intersection on April 4, 2012. The data were recorded in 15-minute intervals for the peak traffic periods in the morning, from 7:00 to 9:00 AM, and in the evening, from 4:00 to 6:00 PM. Traffic count summaries are provided in Appendix A. A comparison of the traffic volumes for three different years is shown in Table 2. The three years represented three different analysis scenarios:
The comparison of the traffic volumes for the three conditions indicates that the overall expected traffic growth did not occur. Basically, the overall volumes remained relatively the same from 1998 to 2012, although there were some individual increases to some of the turning movements.
Table 2
Traffic Volume Comparison
|
Park Avenue Extension |
Summer Street |
Total |
|||||||||||
|
Northbound |
Southbound |
Eastbound |
Westbound |
||||||||||
Scenario |
LT |
TH |
RT |
LT |
TH |
RT |
LT |
TH |
RT |
LT |
TH |
RT |
||
AM |
1998 FDR “Before” |
22 |
128 |
30 |
25 |
293 |
32 |
9 |
370 |
27 |
33 |
438 |
10 |
1,417 |
2020 FDR “Projected” |
24 |
141 |
33 |
28 |
323 |
35 |
10 |
408 |
30 |
36 |
483 |
11 |
1,562 |
|
2012 “After” |
27 |
94 |
25 |
51 |
311 |
13 |
18 |
337 |
53 |
40 |
402 |
24 |
1,395 |
|
PM |
1998 FDR “Before” |
17 |
275 |
30 |
6 |
128 |
14 |
27 |
451 |
12 |
21 |
389 |
8 |
1,378 |
2020 FDR “Projected” |
18 |
304 |
33 |
7 |
141 |
15 |
30 |
498 |
13 |
23 |
429 |
9 |
1,520 |
|
2012 “After” |
50 |
297 |
19 |
12 |
178 |
20 |
18 |
410 |
46 |
33 |
336 |
14 |
1,433 |
|
Note: LT = left turn; TH = through traffic; and RT = right turn.
Note: LT = left turn; TH = through traffic; and RT = right turn.
Based on the turning-movement counts and the signal timing data, the intersection capacity and operations were analyzed using an intersection analysis program, Synchro. The 1998 “Before” existing conditions, 2020 “Projected” Build Conditions, and the analyses of the 2012 “After” conditions for the AM and PM peak hours are shown in Table 3.
As shown in the table, the intersection is currently operating at LOS C in both the AM and PM peak hours. This is one grade lower than the projected level of service, LOS B, which the FDR had projected for 2020 operations. This difference can be attributed to a slight increase in the Park Avenue Extension volumes, specifically the turning volumes.
Table 3
LOS Comparison
|
|
1998 FDR 1 “Before” |
2020 FDR 2 “Projected” |
2012 “After” 3 |
||||||
Intersection/Approach |
Movement |
LOS |
Delay 4 |
Q 5 |
LOS |
Delay |
Q |
LOS |
Delay |
Q |
AM Peak Hour |
||||||||||
Park Ave. Ext. at Summer St. |
|
|
|
|
|
|
|
|
|
|
Park Ave. Ext. – NB |
LTR |
B |
8.3 |
n/a |
B |
11.7 |
n/a |
B |
12.5 |
85 |
Park Ave. Ext. – SB |
lTR |
B |
11.0 |
n/a |
B |
9.3 |
n/a |
B |
17.0 |
233 |
Summer St. – EB |
LTR |
b |
8.3 |
n/a |
B |
8.8 |
n/a |
C |
22.0 |
248 |
Summer St. – WB |
LTR |
b |
10.6 |
n/a |
B |
13.4 |
n/a |
C |
30.9 |
330 |
Overall |
|
B |
9.8 |
- |
B |
11.0 |
- |
C |
22.3 |
- |
PM Peak Hour |
||||||||||
Park Ave. Ext. at Summer St. |
|
|
|
|
|
|
|
|
|
|
Park Ave. Ext. – NB |
LTR |
B |
9.6 |
n/a |
B |
11.6 |
n/a |
B |
16.3 |
243 |
Park Ave. Ext. – SB |
lTR |
B |
8.2 |
n/a |
B |
9.1 |
n/a |
B |
12.1 |
120 |
Summer St. – EB |
LTR |
b |
13.1 |
n/a |
B |
12.2 |
n/a |
C |
27.1 |
292 |
Summer St. – WB |
LTR |
b |
9.1 |
n/a |
B |
8.1 |
n/a |
C |
24.5 |
249 |
Overall |
|
B |
10.6 |
- |
B |
10.6 |
- |
C |
21.3 |
- |
1 1998 “Before” Existing Traffic Volumes.
2 2020 “Projected” Future Traffic Volumes with Build Conditions.
3 2012 “After” Existing Traffic Volumes.
4 Delay is measured in seconds.
5 Queue is measured in feet.
The intersection of Forest Street South at Summer Street is a three-legged intersection with Summer Street running east-west. The segment of Summer Street in the intersection area is an urban minor arterial. The surrounding land use is single-family residential. There is a baseball field located in the southeast corner of the intersection. Opposite the Forest Street South approach is a small commercial building housing three businesses.
The following sections provide a summary of the before-and-after conditions, along with a comparison of the crash data, traffic volumes, and the traffic analysis.
This three-legged intersection was controlled by a stop sign, with post-mounted flashing red and yellow beacons. The Forest Street South approach was divided by a median island, where motorists could go left or right around it, as shown in Figure 2. Traffic control was provided by both a stop sign and a yield sign, depending whether a motorist was making a left or right turn at the intersection.
The Summer Street lanes were 11.5 feet wide, with 3-foot shoulders. The existing sidewalks were 5 feet in width. Along the north side of Summer Street, there was an 8-foot-wide parking lane available for on-street parking for the adjacent businesses. The Forest Street South approach was also 11 feet in width, with 2-foot shoulders. The sidewalks along Park Avenue Extension were also 5 feet in width. There were 5-foot-wide sidewalks along both sides of Park Avenue Extension.
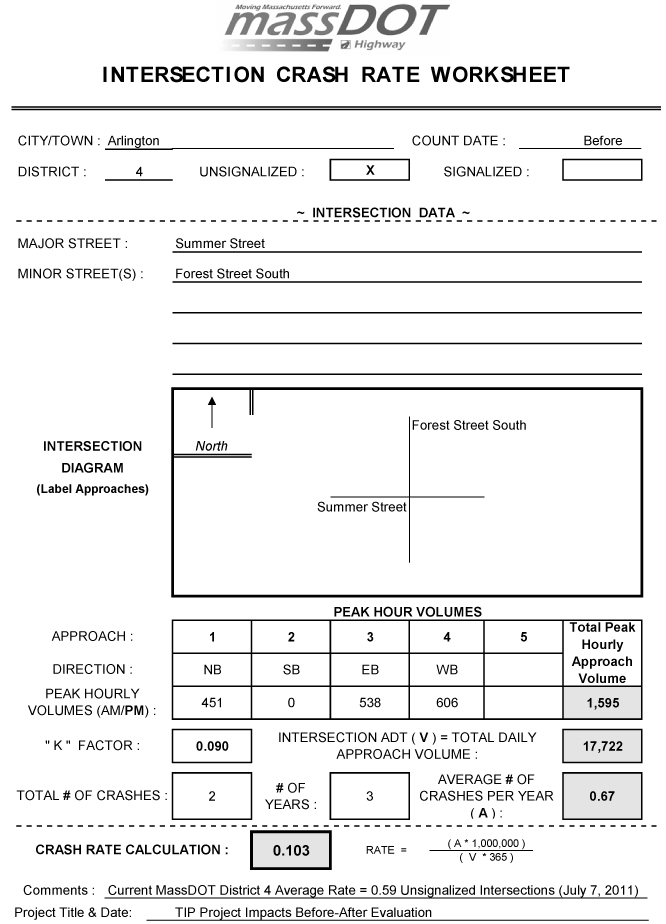
The crash rate before the reconstruction of the intersection was 0.10 crashes per million entering vehicles, which was below District 4’s average of 0.59 for unsignalized intersections.
The traffic operations at the unsignalized intersection were creating a problem for the Forest Street South left turns onto Summer Street. This unsignalized left-turn movement operated at LOS F during both peak hours. Therefore, it was necessary to reconstruct the intersection because of the poor traffic operations and the need to improve pedestrian accommodations.
The intersection was reconstructed to improve both traffic and pedestrian safety with the installation of a traffic signal. The Summer Street approach lanes were widened to 12-foot lanes, with 4-foot shoulders. The sidewalks remained 5 feet wide. The on-street parking lane was widened to 11 feet. On the Forest Street South approach, the median island dividing the left and right turns was removed. An 11-foot left-turn lane and 12-foot right-turn lane were created.
FIGURE 2 -- Before and After Reconstruction of Summer Street at Forest Street (South)
Shows the Summer Street at Forest Street (South) intersection before and after the reconstruction of the intersection.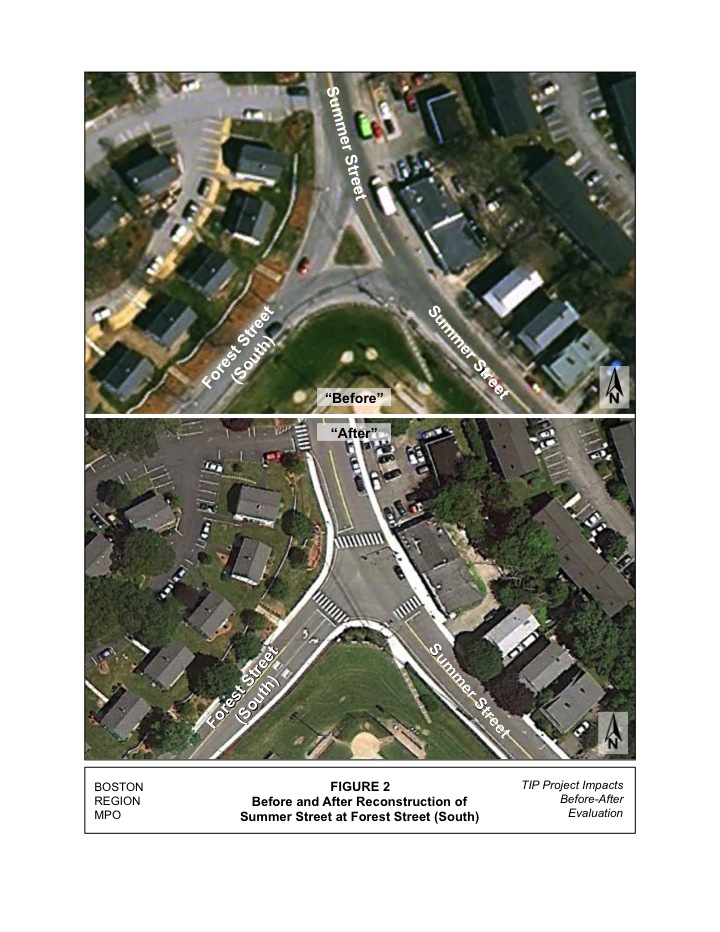
Signal heads were installed on mast arms. For the Summer Street eastbound approach, a single mast arm was installed on the southeast corner. Two signal heads are provided for this approach, one above the roadway and one on the post of the mast arm, to provide clear visibility for motorists. The westbound approach signal heads are also mounted on a mast arm, located opposite Forest Street South. There are two signal heads on the mast arm, one above the roadway and one on the post of the mast arm. The Forest Street South approach has one signal head mounted above the roadway on the mast arm opposite this approach, and one mounted on a separate 10-foot signal post. There are pedestrian signal heads and buttons and an exclusive pedestrian phase. There are crosswalks across all three approaches, shown in Figure 2.
The crash rate for the years 2005 to 2009 is 0.14 crashes per million entering vehicles, and the current traffic operations of the intersection have an acceptable LOS of D in the AM peak hour and LOS C during the PM peak hour.
Crash data from the FDR were compared to current MassDOT Registry of Motor Vehicles Division data for the most recent five years available, 2005 to 2009. Table 4 provides a summary of the crashes.
A total of two crashes were reported in the FDRs for the three–year period 1995 to 1997. During the five recent years of data, for 2005 to 2009, there were four crashes.
Crash rate is another effective tool for examining the relative safety of a particular location. 5 Based on the 1995 to 1997 FDR crash data and the recently available MassDOT data, from 2005 to 2009, the crash rate was 0.10 crashes per million entering vehicles in 1995 to 1997, and 0.14 crashes per million entering vehicles for 2005 to 2009. The District 4 average for unsignalized intersections is 0.58 crashes per million entering vehicles and 0.78 crashes per million entering vehicles for signalized intersections. The crash rate calculation form is included in Appendix B.
Table 4
Crash Data Comparison: FDR (1995–97) to MassDOT (2005–09)
|
FDR 1995 to 1997 |
MassDOT 2005 to 2009 |
||||||||
Intersection |
1995 |
1996 |
1997 |
Crash Rate |
2005 |
2006 |
2007 |
2008 |
2009 |
Crash Rate |
Forest Street South at Summer Street |
1 |
1 |
0 |
0.10 |
0 |
2 |
0 |
1 |
1 |
0.14 |
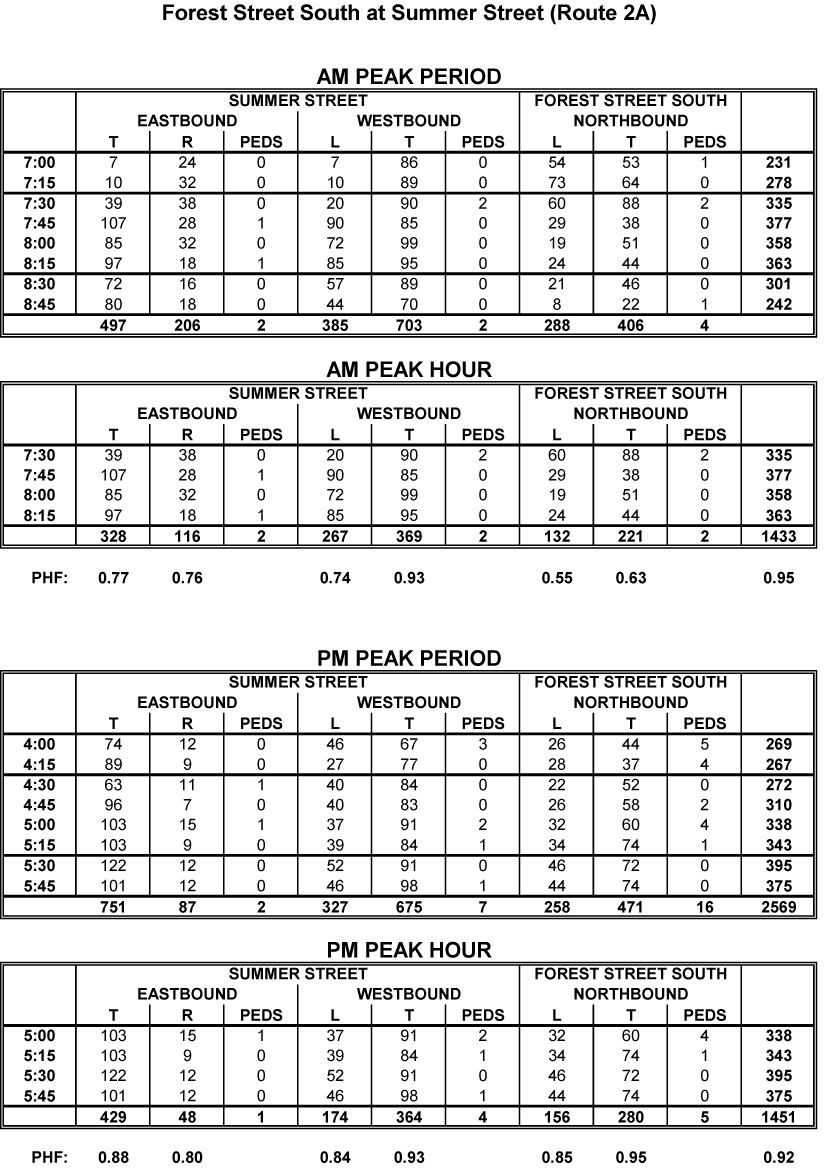
MPO staff collected turning-movement counts at the intersection on April 4, 2012. The data were recorded in 15-minute intervals for the peak traffic periods in the morning, from 7:00 to 9:00 AM, and in the evening, from 4:00 to 6:00 PM. Traffic count summaries are provided in Appendix A. Three different years’ traffic volumes were compared in Table 5. The three years represented three different analyses scenarios:
As shown in Table 5, the overall traffic volumes decreased from 1998 (FDR) to 2012. Traffic never increased to the anywhere near the demand projected for 2020.
Table 5
Traffic Volume Comparison
|
Forest St. South |
Summer Street |
Total |
||||||||
|
Northbound |
Eastbound |
Westbound |
||||||||
Scenario |
LT |
TH |
RT |
LT |
TH |
RT |
LT |
TH |
RT |
||
AM |
1998 FDR “Before” |
103 |
0 |
191 |
0 |
444 |
137 |
290 |
445 |
0 |
1,610 |
2020 FDR Projected” |
114 |
0 |
211 |
0 |
490 |
151 |
320 |
491 |
0 |
1,777 |
|
2012 “After” |
132 |
0 |
221 |
0 |
328 |
116 |
267 |
369 |
0 |
1,433 |
|
PM |
1998 FDR “Before” |
181 |
0 |
270 |
0 |
480 |
58 |
200 |
406 |
0 |
1,595 |
2020 FDR Projected” |
200 |
0 |
298 |
0 |
530 |
64 |
221 |
448 |
0 |
1,761 |
|
2012 “After” |
156 |
0 |
280 |
0 |
429 |
48 |
174 |
364 |
0 |
1,451 |
|
Note: LT = left turn; TH = through traffic; and RT = right turn.
Based on the turning-movement counts and the signal timing data, the 1998 “Before” Existing Conditions, the 2020 “Projected” Build Conditions, and the 2012 “After” analyses for the AM and PM peak hours are shown in Table 6.
The signalization of the intersection has improved the operations of the intersection. The Forest Street South approach has improved from the failing operations prior to the reconstruction. Overall the intersection is operating at LOS D and C in the peak hours. This is one grade lower than the projected LOS C and B, which the FDR had projected for 2020 operations. This difference can be attributed to a slight difference in signal timings from the FDR to the actual signal timings that exist today.
Table 6
LOS Comparison
|
|
1998 FDR 1 “Before” |
2020 FDR 2 “Projected” |
2012 “After” 3 |
||||||
Intersection/Approach |
Movement |
LOS |
Delay 4 |
Q 5 |
LOS |
Delay |
Q |
LOS |
Delay |
Q |
AM Peak Hour |
||||||||||
Forest St. South at Summer St. |
|
|
|
|
|
|
|
|
|
|
Forest St. South – NB |
Lr(l) |
f |
915.7 |
33.3 |
C |
19.8 |
n/a |
E |
76.6 |
135 |
|
(R) |
- |
- |
- |
B |
12.6 |
n/a |
D |
45.0 |
28 |
Summer St. – EB |
TR |
- |
- |
- |
B |
10.0 |
n/a |
B |
13.2 |
290 |
Summer St. – WB |
LT |
b |
7.6 |
2.5 |
D |
32.6 |
n/a |
E |
78.7 |
398 |
Overall |
|
- |
169.0 |
- |
C |
21.6 |
- |
D |
52.6 |
- |
PM Peak Hour |
||||||||||
Forest St. South at Summer St. |
|
|
|
|
|
|
|
|
|
|
Forest St. South – NB |
LR(l) |
f |
536.7 |
38.6 |
C |
17.8 |
n/a |
D |
36.1 |
156 |
|
(R) |
- |
- |
- |
B |
10.4 |
n/a |
C |
28.2 |
65 |
Summer St. – EB |
TR |
- |
- |
- |
B |
14.4 |
n/a |
B |
12.7 |
249 |
Summer St. – WB |
LT |
b |
5.5 |
1.2 |
B |
10.5 |
n/a |
C |
20.4 |
170 |
Overall |
|
- |
152.7 |
- |
B |
12.7 |
- |
C |
21.0 |
- |
1 1998 “Before” Existing Traffic Volumes.
2 2020 “Projected” Future Traffic Volumes with Build Conditions.
3 2012 “After” Existing Traffic Volumes.
4 Delay is measured in seconds.
5 Queue is measured in feet.
The intersection of Brattle Street/Hemlock Street at Summer Street (Figure 3) is a four-way signalized controlled intersection with Summer Street running east-west. In the vicinity of the intersection, Summer Street is an urban minor arterial. The surrounding land use is single-family residential.
The following sections provide a summary of the before-and-after conditions, along with a comparison of the crash data, traffic volumes, and traffic analysis.
This four-way intersection was controlled by 12 post-mounted signal heads. The side street approaches the intersection at a skewed angle, creating an off-set intersection, as shown in Figure 3. The Summer Street lane widths were 11 feet, with 3-foot shoulders. There was an existing 5-foot-wide sidewalk on the eastbound approach. There is no on-street parking available on either the eastbound or westbound approaches. The northbound Brattle Street approach lane was 11 feet in width, with 2-foot shoulders. Three post-mounted signal heads control this approach. The southbound approach had an approximately 24-foot-wide single lane that was used by motorists as two lanes. This approach also had three post-mounted signal heads.
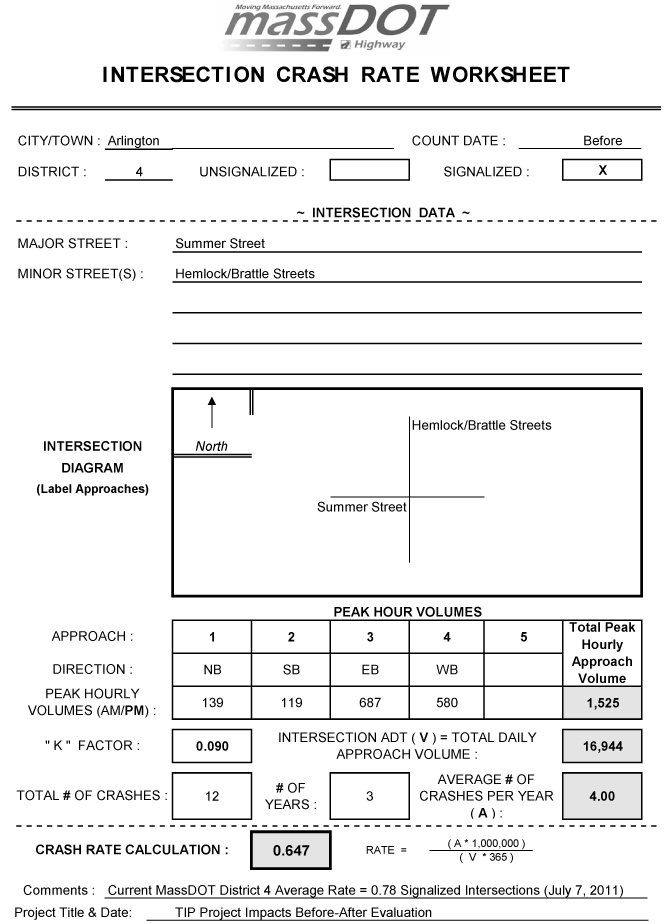
The crash rate before the reconstruction of the intersection was 0.65 crashes per million entering vehicles, which was below District 4’s average of 0.78 for signalized intersections. According to the FDR’s crash analysis section, all 12 crashes at the intersection were rear-end crashes involving eastbound and westbound Summer Street motorists.
Prior to the improvements, the traffic operations were a problem during the AM peak hour. The southbound Hemlock/Brattle Street approach operated at LOS F, and Summer Street westbound also operated at LOS F. Overall the intersection was operating at LOS E during the AM peak hour.
Therefore, it was necessary to reconstruct the intersection to improve operations and safety related due to the poor signal head visibility.
The intersection was reconstructed to improve both traffic operations and safety. The Summer Street approach lanes were widened to 12-foot lanes, with 4-foot shoulders. The northbound Brattle Street approach remained 11 feet wide. The southbound Brattle Street/Hemlock Street was reconfigured, with the addition of a traffic island separating the entering/ vehicles from the exiting vehicles. In addition, a short left-turn lane was provided, along with a through/right-turn lane, as shown in Figure 3.
FIGURE 3 -- Before and After Reconstruction of Summer Street at Brattle Street/Hemlock Road
Shows the Summer Street at Brattle Street/Hemlock Street intersection before and after the reconstruction of the intersection.
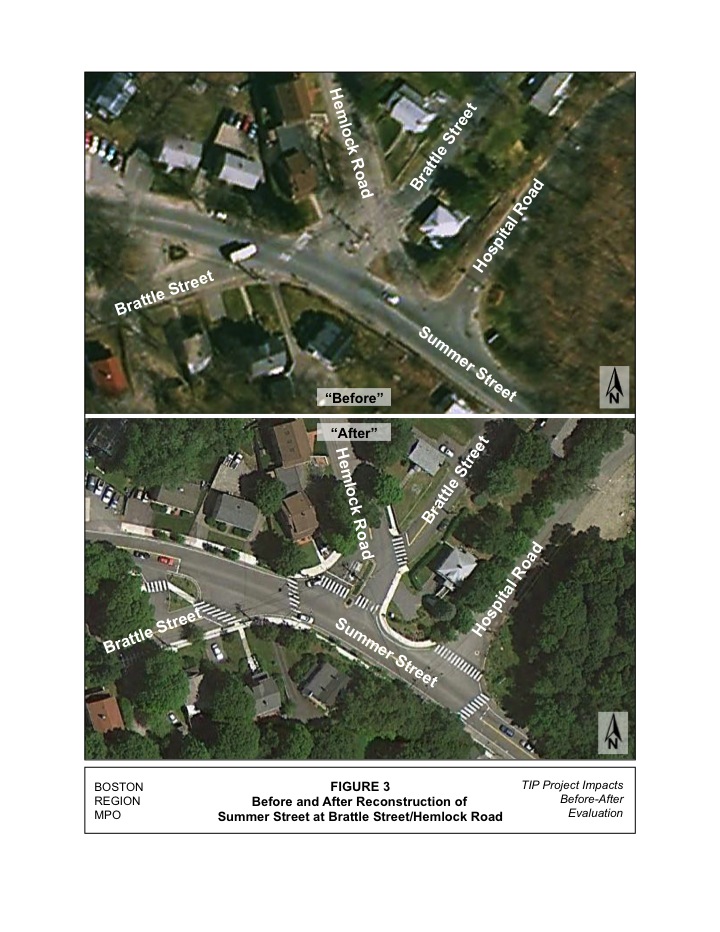
The signal visibility was improved by installing mast arms. For the Summer Street approaches, mast arms were installed in the northwest corner and along the south side of Summer Street opposite Hospital Road. Each mast arm has two signal heads for each approach mounted over the roadway. For the northbound Brattle Street approach, a signal is also mounted on the mast arm on the northwest corner and another signal head is provided on the post of the mast arm. The southbound approach has a signal head mounted on a mast arm on the southeast corner of the intersection and another mounted on a 10-foot signal post opposite the southbound left-turn lane. Pedestrian heads and buttons are on all four corners of the intersection, and an exclusive pedestrian phase was provided.
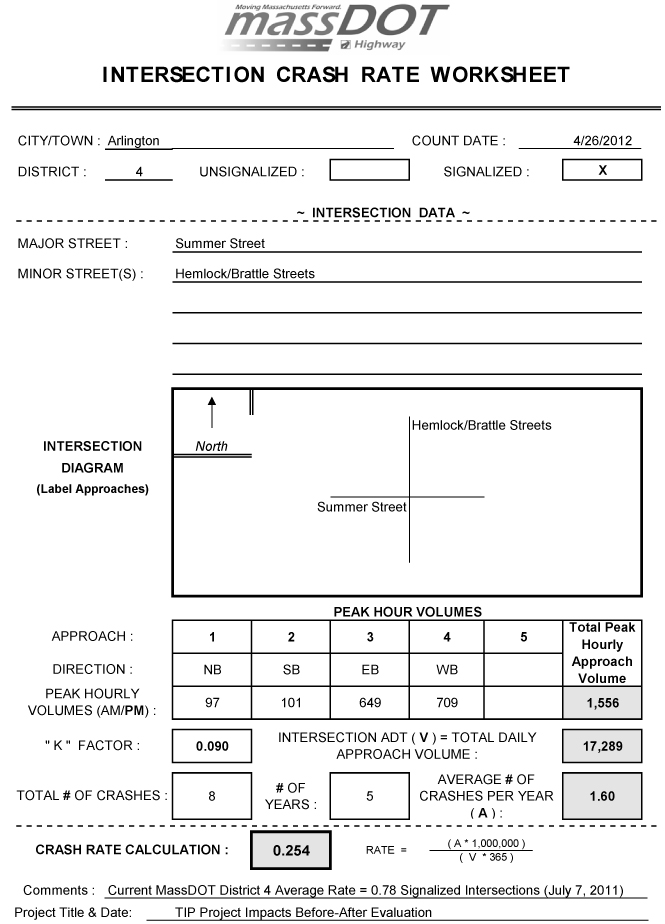
The crash rate for the years 2005 to 2009 is 0.25 crashes per million entering vehicles, which is less than half of the crash rate before the reconstruction. It is obvious that the improved signal head visibility of mast-arm-mounted signal heads has improved the safety of the intersection and reduced the rate of rear-end crashes.
An analysis of the current traffic operations indicates that the intersection is operating as was proposed—at LOS C and LOS B during the peak hours, respectively. The movements mentioned in the “Before” section as having failed during the AM peak hour are now operating at LOS B for the Hemlock Street/Brattle Street approach and LOS C for Summer Street westbound.
Crash data from the FDR (1995–97) were compared to current MassDOT Registry of Motor Vehicles Division data for the most recent five years available, 2005 to 2009. Table 7 provides a summary of the crashes.
A total of 12 crashes occurred during the three years reported in the FDR, 1995 to 1997. During the five most recent years for which data were available, 2005 to 2009, there were 8 crashes.
Based on the 1995 to 1997 FDR crash data and the recently available MassDOT data, from 2005 to 2009, the crash rate was 0.65 crashes per million entering vehicles in the earlier period, and 0.25 crashes per million entering vehicles for 2005 to 2009. The District 4 average for signalized intersections is 0.78 crashes per million entering vehicles. The crash rate calculation form is included in Appendix B.
Table 7
Crash Data Comparison: FDR (1995–97) to MassDOT (2005–09)
|
FDR 1995 to 1997 |
MassDOT 2005 to 2009 |
||||||||
Intersection |
1995 |
1996 |
1997 |
Crash Rate |
2005 |
2006 |
2007 |
2008 |
2009 |
Crash Rate |
Brattle/Hemlock Streets at Summer Street |
6 |
2 |
4 |
0.65 |
1 |
2 |
1 |
3 |
1 |
0.25 |
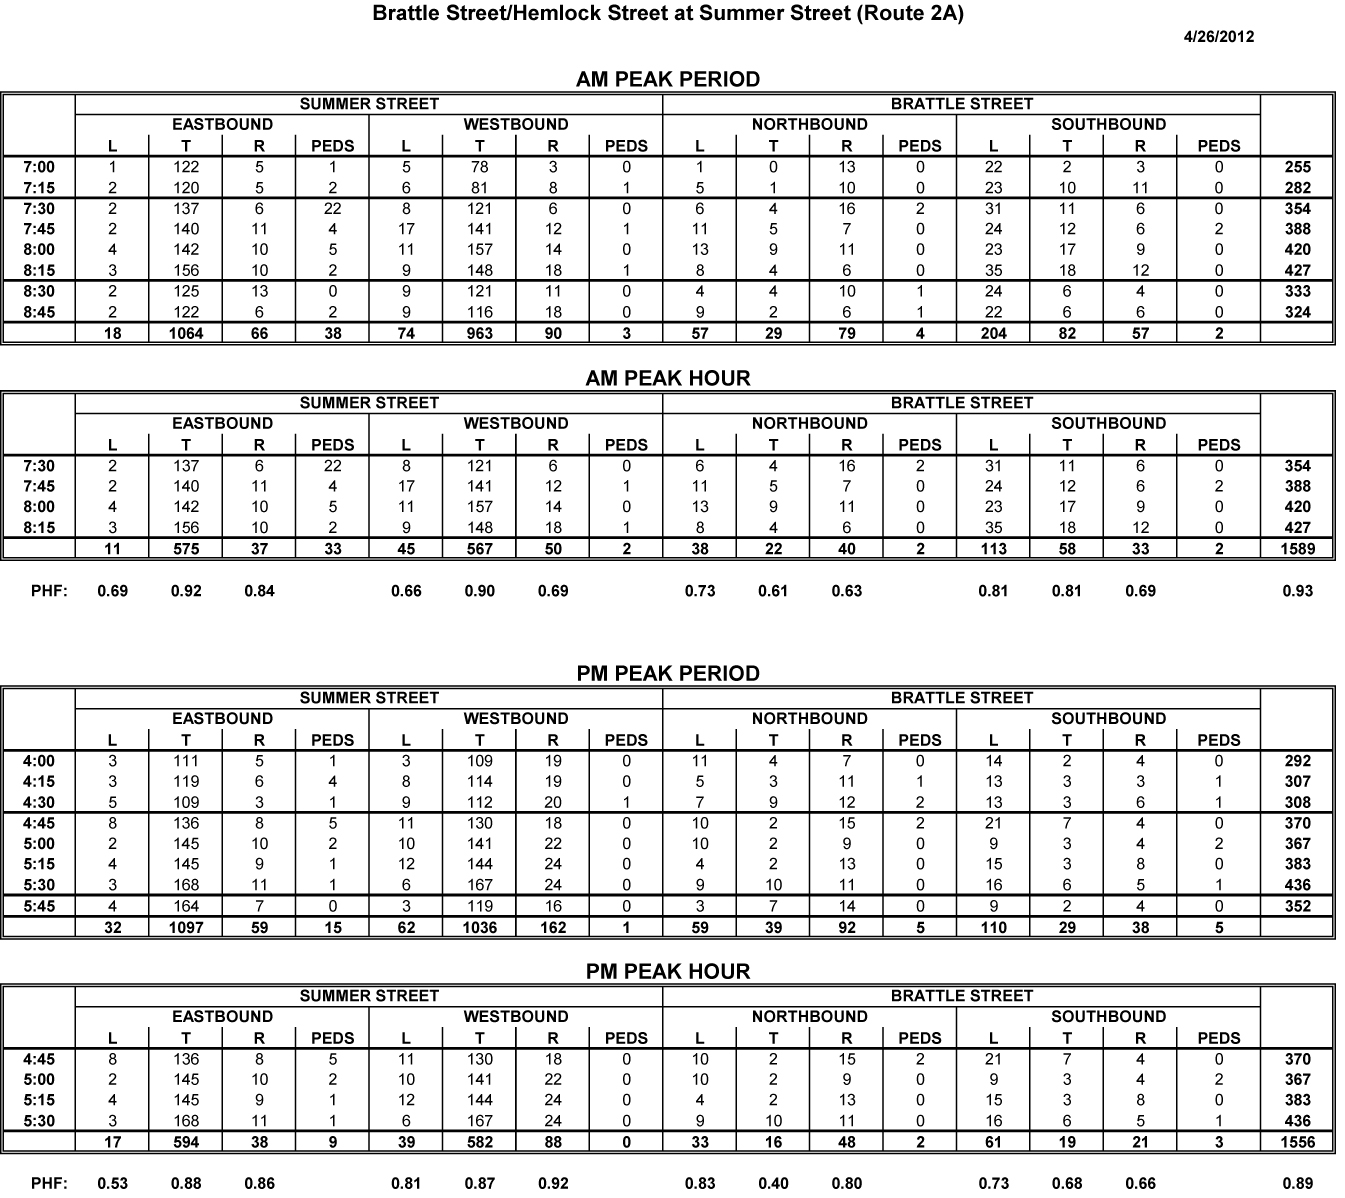
MPO staff collected turning-movement counts at the intersection on April 26, 2012. The data were recorded in 15-minute intervals for the peak traffic periods in the morning, from 7:00 to 9:00 AM, and in the evening, from 4:00 to 6:00 PM. Traffic count summaries are provided in Appendix A. Traffic volumes for three different years are listed in Table 8 for three different analysis scenarios:
As indicated in Table 8, the overall traffic volumes remained the same from the 1998 FDR to the 2012 volumes. Traffic volumes never increased to anywhere near the demand projected for 2020.
Table 8
Traffic Volume Comparison
|
Brattle St. |
Hemlock Street |
Summer Street |
Total |
||||||||||
|
Northbound |
Southbound |
Eastbound |
Westbound |
||||||||||
Scenario |
LT |
TH |
RT |
LT |
TH |
RT |
LT |
TH |
RT |
LT |
TH |
RT |
||
AM |
1998 FDR “Before” |
50 |
28 |
68 |
170 |
57 |
27 |
4 |
550 |
0 |
72 |
558 |
0 |
1,584 |
2020 FDR Projected” |
55 |
31 |
75 |
188 |
63 |
30 |
4 |
607 |
0 |
79 |
616 |
0 |
1,748 |
|
2012 “After” |
38 |
22 |
40 |
113 |
58 |
33 |
11 |
575 |
37 |
45 |
567 |
50 |
1,589 |
|
PM |
1998 FDR “Before” |
36 |
29 |
74 |
70 |
26 |
23 |
17 |
670 |
0 |
50 |
530 |
0 |
1,525 |
2020 FDR Projected” |
39 |
32 |
82 |
77 |
29 |
25 |
19 |
740 |
0 |
55 |
585 |
0 |
1,683 |
|
2012 “After” |
33 |
16 |
48 |
61 |
19 |
21 |
17 |
594 |
38 |
39 |
582 |
88 |
1,556 |
|
Note: LT = left turn; TH = through traffic; and RT = right turn.
Based on the turning-movement counts and the signal timing data, the 1998 “Before” existing conditions, 2020 “Projected” Build, and 2012 “After” analyses for the AM and PM peak hours are shown in Table 9.
The reconstruction of the intersection has improved the operations to LOS C and LOS B during the AM and PM peak hours, respectively. The widening of Hemlock Street to two lanes has improved this approach in the AM peak period to LOS B from the preconstruction LOS of F.
Table 9
LOS Comparison
|
|
1998 FDR 1 “Before” |
2020 FDR 2 “Projected” |
2012 “After” 3 |
||||||
Intersection/Approach |
Movement |
LOS |
Delay 4 |
Q 5 |
LOS |
Delay |
Q |
LOS |
Delay |
Q |
AM Peak Hour |
||||||||||
Brattle/Hemlock Sts. at Summer St. |
|
|
|
|
|
|
|
|
|
|
Brattle St. – NB |
LTR |
c |
20.4 |
n/a |
D |
23.7 |
n/a |
C |
29.2 |
80 |
Hemlock St. – SB |
lTR(l) |
F |
102.8 |
n/a |
C |
19.5 |
n/a |
B |
19.7 |
110 |
|
(tr) |
|
|
|
|
|
|
B |
18.8 |
80 |
Summer St. – EB |
LTR |
b |
6.3 |
n/a |
C |
32.1 |
n/a |
B |
16.1 |
331 |
Summer St. – WB |
LTR |
F |
64.2 |
n/a |
C |
15.6 |
n/a |
C |
24.8 |
448 |
Overall |
|
E |
44.4 |
- |
C |
21.8 |
- |
C |
21.2 |
- |
PM Peak Hour |
||||||||||
Brattle/Hemlock Sts. at Summer St. |
|
|
|
|
|
|
|
|
|
|
Brattle St. – NB |
LTR |
c |
16.7 |
n/a |
C |
17.1 |
n/a |
C |
28.0 |
43 |
Hemlock St. – SB |
lTR(l) |
C |
17.2 |
n/a |
C |
17.7 |
n/a |
B |
17.8 |
59 |
|
(tr) |
|
|
|
|
|
|
B |
16.9 |
31 |
Summer St. – EB |
LTR |
b |
7.7 |
n/a |
C |
18.4 |
n/a |
B |
15.3 |
309 |
Summer St. – WB |
LTR |
C |
23.6 |
n/a |
B |
6.7 |
n/a |
C |
23.2 |
446 |
Overall |
|
C |
15.6 |
- |
B |
13.7 |
- |
B |
19.9 |
- |
(x) – Build conditions turning-lane configuration.
1 1998 “Before” Existing Traffic Volumes.
2 2020 “Projected” Future Traffic Volumes with Build Conditions.
3 2012 “After” Existing Traffic Volumes.
4 Delay is measured in seconds.
5 Queue is measured in feet.
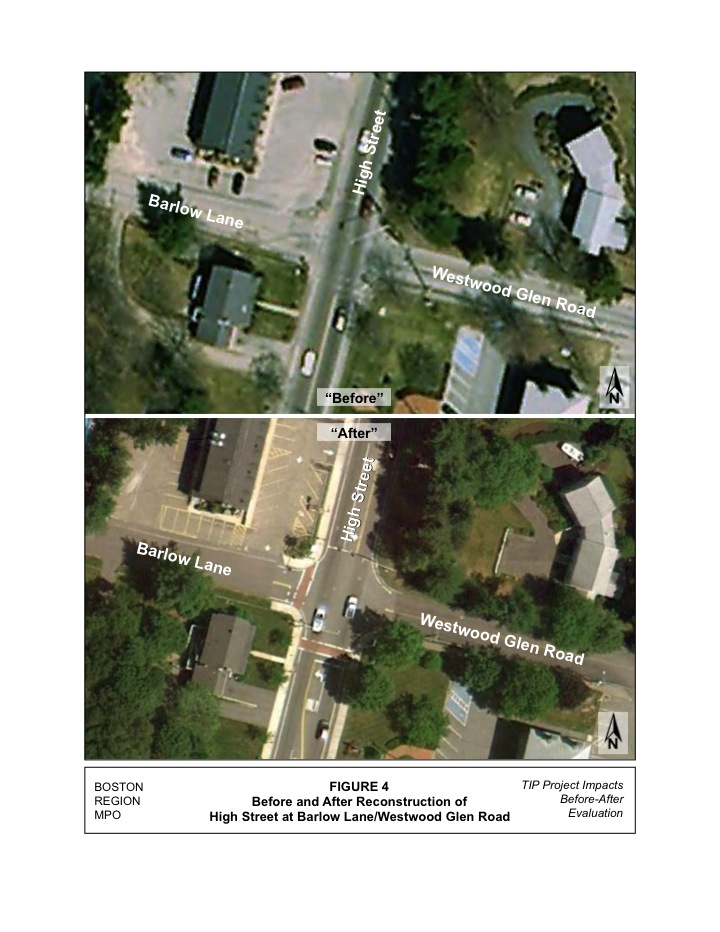
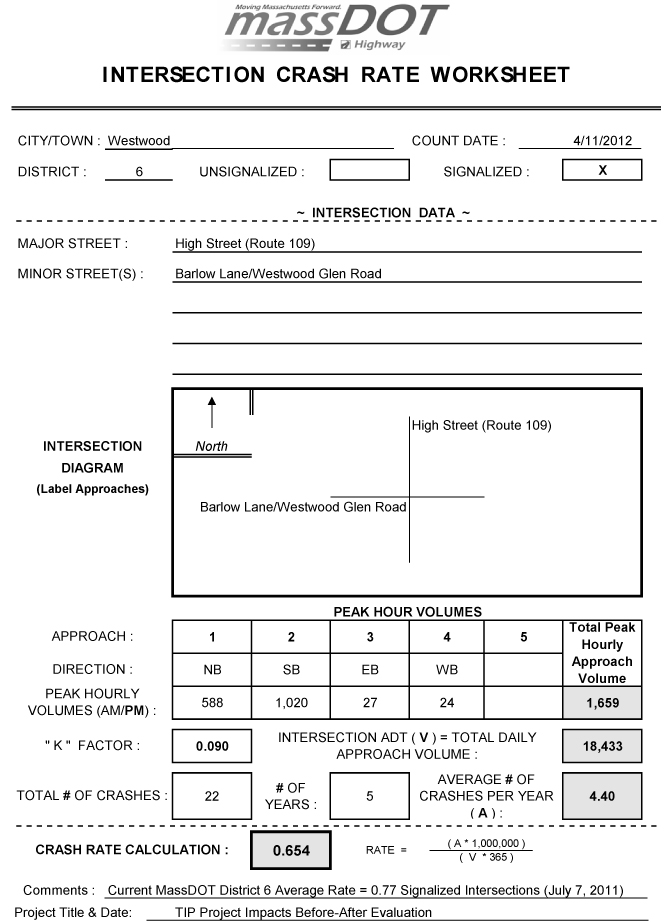
The High Street at Barlow Lane/Westwood Glen Road intersection is a four-way signalized controlled intersection with High Street running north/south. High Street is a two lane principal arterial running through a portion of the central business district of Westwood and bordering a residential area.
The following sections provide a summary of the before/after conditions, along with a comparison of the crash data, traffic volumes, and traffic analysis.
Based on the limited information provided in the FDR, the intersection was experiencing severe difficulties in serving the northbound High Street traffic in the AM peak hours; with the northbound traffic having a LOS E during the AM peak hour. This was due to the heavy commuter traffic traveling to I-95. The “Before” conditions are shown in Figure 4.
The crash rate before the reconstruction of the intersection was 0.34 crashes per million entering vehicles, which is below District 6’s average of 0.77 for signalized intersections. According to the FDR’s crash analysis section, most of the 19 crashes were rear end crashes on High Street.
The traffic operations were a problem during the AM peak hour. As previously stated, the northbound traffic had a LOS E during the AM peak hour. Overall the intersection operated at LOS D and LOS B during the AM and PM peak hours, respectively. So the need to reconstruct the intersection was to improve traffic operations and safety.
The intersection was reconstructed to both improve traffic and pedestrian safety. Left- turn lanes were added to both High Street approaches. Four mast arms were installed, one on each corner. Two signal heads were provided for each approach above the roadway. Crosswalks were installed across Barlow Lane and across High Street on the south side of the intersection, as shown in Figure 4. Pedestrian equipment was provided as well as improved sidewalks along High Street.
The crash rate for the years 2005 to 2009 is 0.65 crashes per million entering vehicles, which is below District 6’s average crash rate for signalized intersections.
The current traffic operations of the intersection indicate that it is operating as it was proposed. It is operating at LOS A during both the AM and PM peak hours. The northbound High Street approach is now operating at LOS A during the AM peak hour.
FIGURE 4 -- Before and After Reconstruction of High Street at Barlow Lane/Westwood Glen Road
Shows the High Street at Barlow Lane/Westwood Glen Road intersection before and after the reconstruction of the intersection.
Crash data was compared from the FDR to current MassDOT Registry of Motor Vehicles Division data for the most recent five years available, 2005 to 2009. Table 10 provides a summary of the crashes.
A total of 19 crashes occurred during the three years reported in the FDR. During the five recent years of data from 2005 to 2009 there were 22 crashes occurred.
Based on the 1994 to 1996 FDR crash data and the recently available MassDOT data, for 2005 to 2009, the crash rate was 0.87 crashes per million entering vehicles during the earlier time period and 0.65 crashes per million entering vehicles for 2005 to 2009. Thus, the reconstruction improved the safety of the intersection. The latter crash rate is below the District 6 average for signalized intersections, which is 0.77 crashes per million entering vehicles. The crash rate calculation form is included in Appendix B.
Table 10
Crash Data Comparison: FDR (1994–96) to MassDOT (2005–09)
|
FDR 1994 to 1996 |
MassDOT 2005 to 2009 |
||||||||
Intersection |
1994 |
1995 |
1996 |
Crash Rate |
2005 |
2006 |
2007 |
2008 |
2009 |
Crash Rate |
High Street (Route 109) at Barlow Lane/ Westwood Glen Road |
8 |
10 |
1 |
0.87 |
1 |
6 |
5 |
6 |
4 |
0.65 |
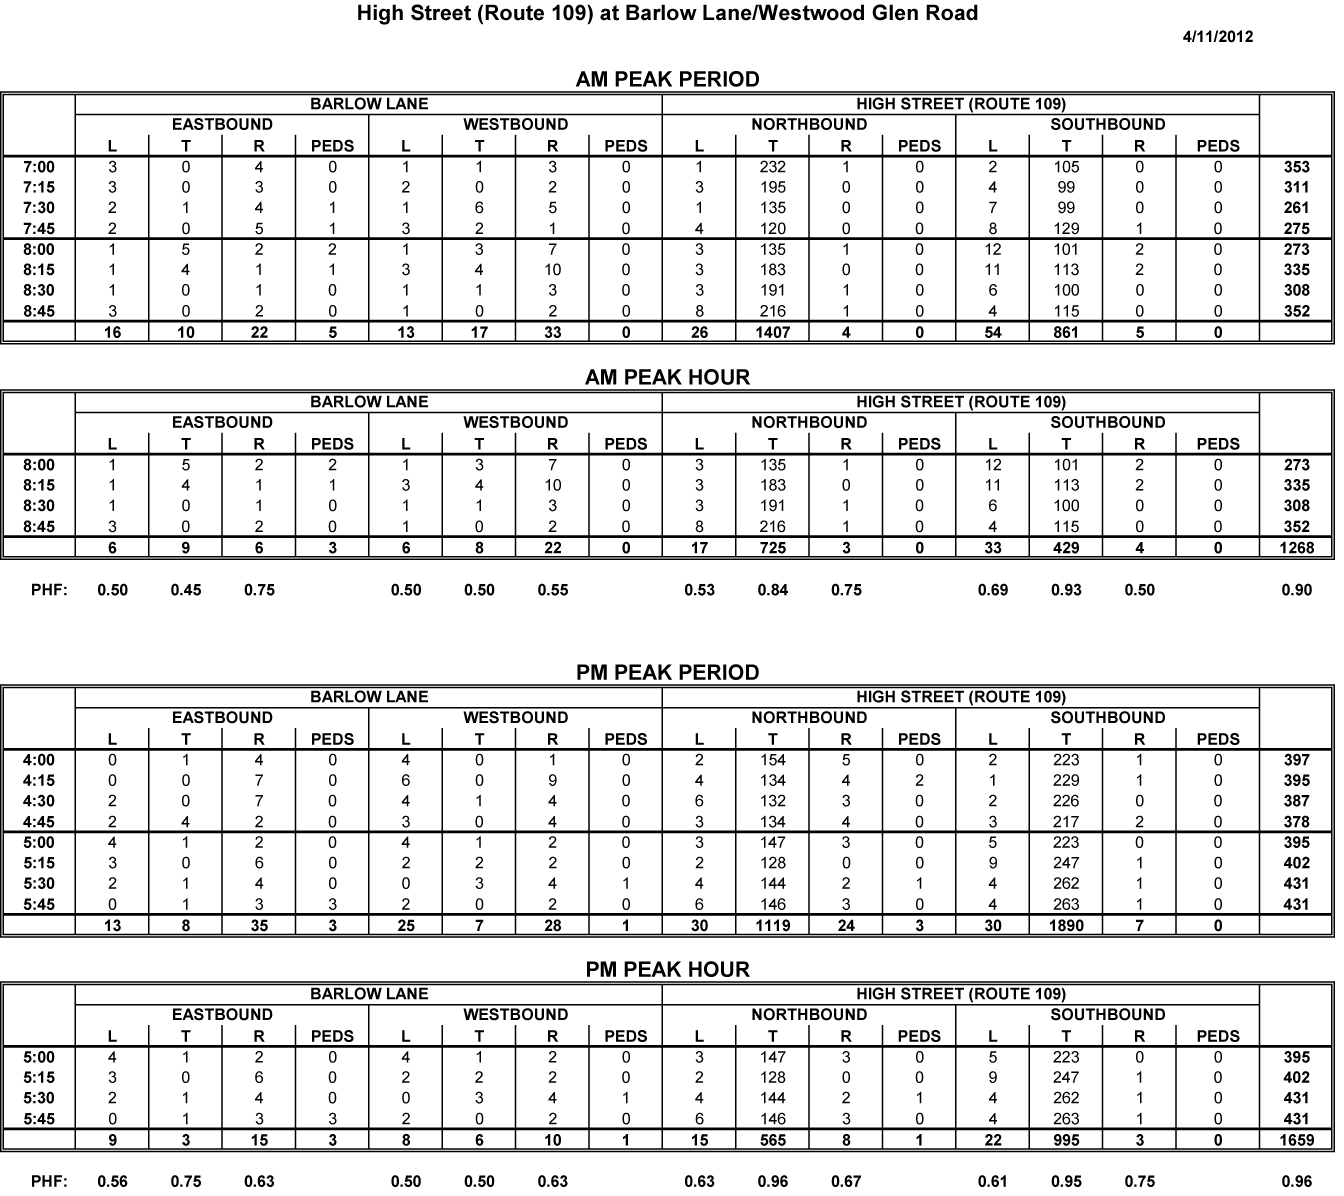
MPO staff collected turning-movement counts at the intersection on April 11, 2012. The data were recorded in 15-minute intervals for the peak traffic periods in the morning, from 7:00 to 9:00 AM, and in the evening, from 4:00 to 6:00 PM. Traffic count summaries are provided in Appendix A. Three different years traffic volumes were compared in Table 11. The three years represented three different analyses scenarios:
As shown in Table 11, the overall traffic volumes decreased from the 1998 FDR to the 2012 volumes. Traffic never grew to anywhere near the demand projected in 2007.
Table 11
Traffic Volume Comparison
|
High Street (Route 109) |
Barlow Street |
Westwood Glen |
Total |
||||||||||
|
Northbound |
Southbound |
Eastbound |
Westbound |
||||||||||
Scenario |
LT |
TH |
RT |
LT |
TH |
RT |
LT |
TH |
RT |
LT |
TH |
RT |
||
AM |
1997 FDR “Before” |
9 |
1,375 |
3 |
5 |
624 |
4 |
6 |
0 |
10 |
10 |
0 |
16 |
2,062 |
2007 FDR “Projected” |
9 |
1,445 |
3 |
5 |
655 |
4 |
6 |
0 |
10 |
10 |
0 |
16 |
2,163 |
|
2012 “After” |
17 |
725 |
3 |
33 |
429 |
4 |
6 |
9 |
6 |
6 |
8 |
22 |
1,268 |
|
PM |
1997 FDR “Before” |
9 |
618 |
4 |
9 |
1,079 |
2 |
9 |
3 |
33 |
18 |
1 |
5 |
1,790 |
2007 FDR Projected” |
9 |
649 |
4 |
9 |
1,134 |
2 |
9 |
3 |
34 |
18 |
1 |
5 |
1,877 |
|
2012 “After” |
15 |
565 |
8 |
22 |
995 |
3 |
9 |
3 |
15 |
8 |
6 |
10 |
1,659 |
|
Note: LT = left turn; TH = through traffic; and RT = right turn.
Based on the turning-movement counts and the signal timing data, the 1998 FDR “Before” Existing) Conditions, 2007 “Projected” Build Conditions, and the 2012 “After” Conditions for the AM and PM peak hours are shown in Table 12.
The overall operations of the intersection are currently LOS A in both peak hours.
Table 12
LOS Comparison
|
|
1997 FDR 1 “Before” |
2007 FDR 2 “Projected” |
2012 “After” 3 |
||||||
Intersection/Approach |
Movement |
LOS |
Delay 4 |
Q 5 |
LOS |
Delay |
Q |
LOS |
Delay |
Q |
AM Peak Hour |
||||||||||
High St. at Barlow Ln./Westwood Glen Rd. |
|
|
|
|
|
|
|
|
|
|
High Street – NB |
LTR(L) |
e |
46.5 |
n/a |
A |
0.6 |
n/a |
A |
1.8 |
4 |
|
(Tr) |
- |
- |
- |
E |
55.3 |
n/a |
A |
5.7 |
299 |
High Street – SB |
LTR(L) |
A |
1.6 |
n/a |
A |
0.6 |
n/a |
A |
2.9 |
8 |
|
(Tr) |
|
|
|
A |
1.3 |
n/a |
A |
3.2 |
133 |
Barlow Lane – EB |
LTR |
d |
34.49 |
n/a |
D |
34.4 |
n/a |
D |
54.7 |
25 |
Westwood Glen Road – WB |
LTR |
d |
35.2 |
n/a |
D |
35.2 |
n/a |
D |
53.9 |
22 |
Overall |
|
d |
32.5 |
- |
D |
38.1 |
- |
A |
8.2 |
- |
PM Peak Hour |
||||||||||
High St. at Barlow Ln./Westwood Glen Rd. |
|
|
|
|
|
|
|
|
|
|
High Street – NB |
LTR(L) |
a |
4.5 |
n/a |
A |
2.2 |
n/a |
A |
5.0 |
4 |
|
(Tr) |
- |
- |
- |
A |
3.6 |
n/a |
A |
4.0 |
195 |
High Street – SB |
LTR(L) |
C |
18.2 |
n/a |
A |
1.9 |
n/a |
A |
1.9 |
5 |
|
(Tr) |
|
|
|
C |
19.5 |
n/a |
A |
7.6 |
559 |
Barlow Lane – EB |
LTR |
d |
28.1 |
n/a |
D |
28.1 |
n/a |
D |
54.0 |
19 |
Westwood Glen Road – WB |
LTR |
d |
27.5 |
n/a |
D |
27.5 |
n/a |
D |
54.3 |
25 |
Overall |
|
b |
13.7 |
- |
B |
14.1 |
- |
A |
8.4 |
- |
1 1997 “Before” Existing Traffic Volumes.
2 2007 “Projected” Future Traffic Volumes with Build Conditions.
3 2012 “After” Existing Traffic Volumes.
4 Delay is measured in seconds.
5 Queue is measured in feet.
Based on the review of the above projects, the information given in the FDRs, and the “after” analysis performed as part of this study, the following conclusions can be drawn about the reconstruction and benefits of the projects:
One problem encountered in this study was finding adequate or diversified projects to review. While a large number of projects met the criteria of having construction completed by 2008 or 2009, finding the corresponding FDRs for the projects proved troublesome. As with the two projects studied, the FDRs were 12 and 16 years old, respectively, and were not available electronically.
MSA/msa
Appendix A
Turning-Movement Counts (TMCs) for the Study Area Roadways
Park Avenue Extension at Summer Street (Route 2A) — Arlington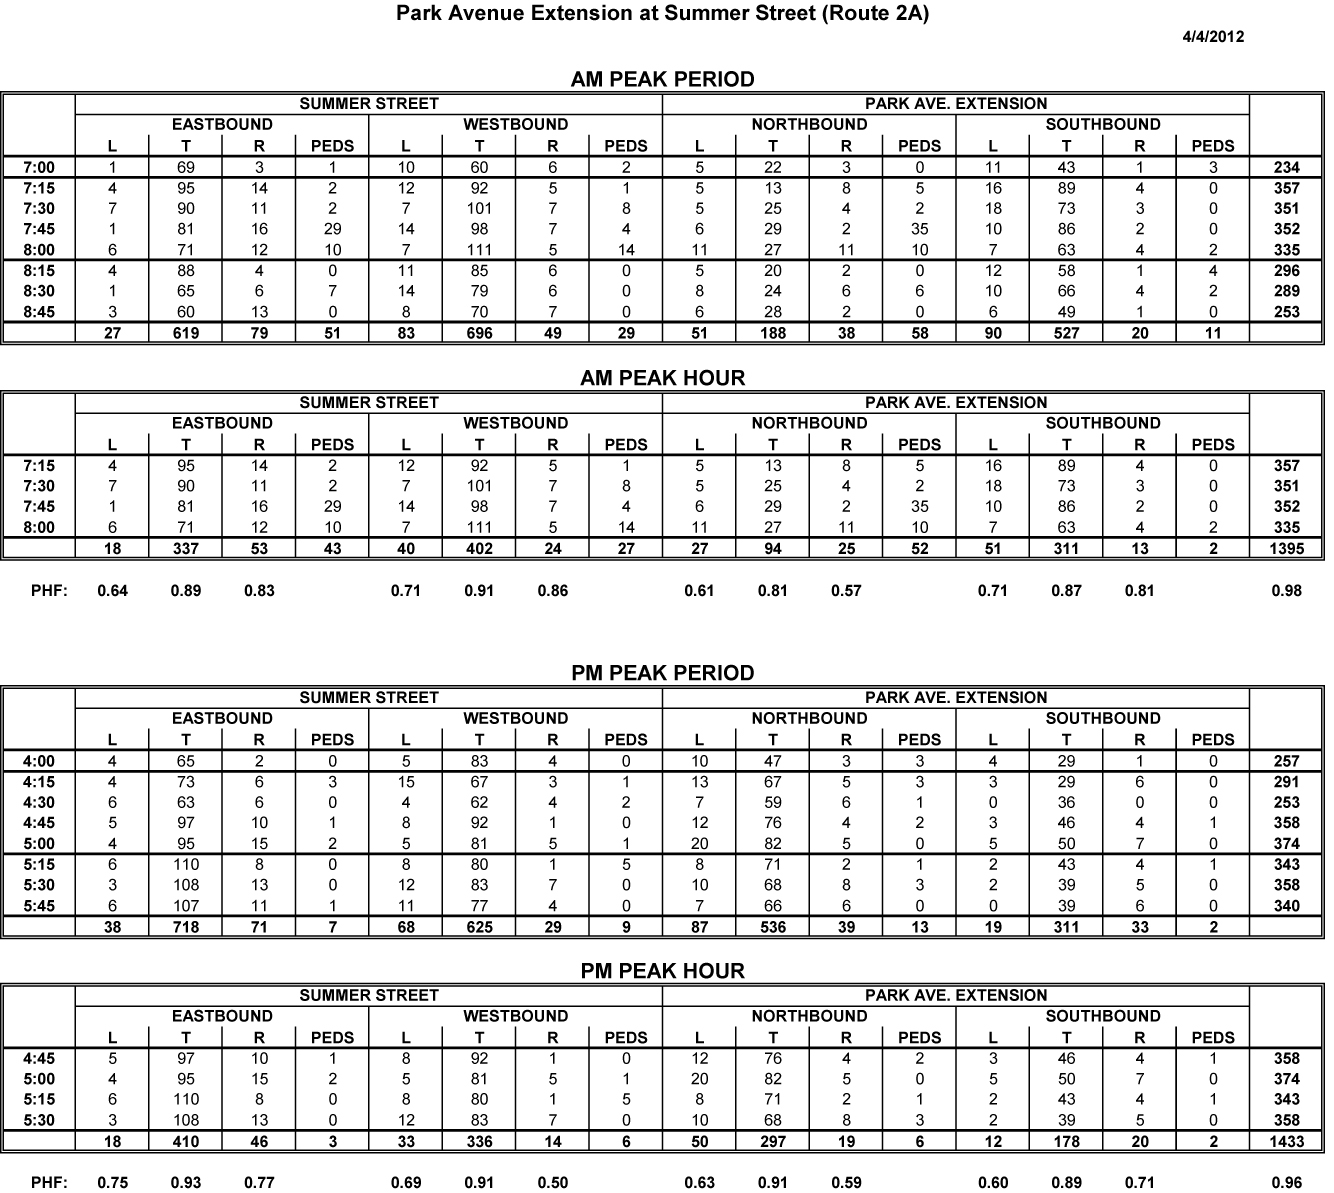
Forest Street South at Summer Street (Route 2A) — Arlington
Brattle/Hemlock Streets at Summer Street (Route 2A) — Arlington
High Street (Route 109) at Barlow Lane/Westwood Glen Road — Westwood
Appendix B
Calculation of Crash Rates
Park Avenue Extension at Summer Street (Route 2A) — Arlington

Forest Street South at Summer Street (Route 2A) — Arlington

Brattle/Hemlock Streets at Summer Street (Route 2A) — Arlington
High Street (Route 109) at Barlow Lane/Westwood Glen Road — Westwood

1 “Forest Street South” refers to the segment of Forest Street that is located south of Summer Street. The segment of Forest Street that is north of Summer Street intersects Summer Street farther west.
2 MassDOT Project Information website: http://www.mhd.state.ma.us/default.asp?pgid=content/projectsRoot&sid=wrapper&iid=http://www.mhd.state.ma.us//ProjectInfo/
4 Synchro Version 7 was used for these analyses. This software is developed and distributed by Trafficware Ltd. It can perform capacity analysis and traffic simulation (when combined with SimTraffic) for an individual intersection or a series of intersections.
5 Crash rates are estimated based on crash frequency (crashes per year) and vehicle exposure (traffic volumes or miles traveled). Crash rates are expressed as “crashes per million entering vehicles” for intersection locations and as “crashes per million miles traveled” for roadway segments.