Memorandum
Date January 17, 2013
To Boston Region MPO
From Alicia Wilson
MPO Staff
Re Title VI and Environmental Justice Demographic Profiles of the Region
Every 10 years, the U.S. Census Bureau uses its census to determine population and race by place of residence. Many population shifts occur during each succeeding decade. Communities gain or lose population. People move into or out of the MPO region or from town to town within the region. The racial composition of the region can also change. The Census Bureau uses the American Community Survey (discussed further in the Data Sources section) to determine income and linguistic characteristics of the population.
For planning purposes, it is essential to understand who lives in the MPO region. In addition to planning needs, entities that receive federal funds are required to develop and use demographic profiles to ensure that the rights of classes of people protected under various acts and presidential executive orders are not ignored during planning, selection, and implementation of various projects and services.
The purpose of this memorandum is to keep MPO members informed about developments related to this important topic. The memorandum first describes the various federal mandates that require MPOs to develop demographic profiles of their regions. It then defines the thresholds the MPO uses, discusses the sources of demographic data, and discusses the demographic profiles of the region and explains how they apply to the various mandates.
Title VI of the Civil Rights Act of 1964 protects people from discrimination based on race, color, and national origin. The Environmental Justice Executive Order 12898 of February 11, 1994, expands upon Title VI, requiring each federal agency to achieve environmental justice by identifying and addressing any disproportionately high adverse human health or environmental effects, including interrelated social and economic effects, of its programs, policies, and activities on minority or low-income populations. Executive Order 13166 of August 11, 2000, calls for improved access to federally conducted and federally assisted programs and activities for persons, who as a result of national origin, have limited English proficiency (LEP).
The Federal Transit Administration’s Title VI and environmental justice circulars (FTA C4702.1B and FTA C 4703.1, respectively) require demographic profiles of the area encompassed by the MPO. The MPO uses these demographic data for several purposes: to identify geographic areas where minority populations exceed the MPO average, to identify LEP populations, to identify potential transportation project benefits and burdens on low-income and minority populations, to help evaluate Transportation Improvement Program (TIP) projects, and to do outreach to engage low-income, minority, and LEP populations in the MPO planning process.
The MPO’s Transportation Equity program meets all environmental justice requirements. The program currently engages populations of concern (low-income, minority, and LEP) that have been identified through demographic profiles, and gathers information on their transportation needs and concerns. The MPO is required to submit a comprehensive Title VI report (which includes demographic profiles) to the Massachusetts Department of Transportation every three years. Updates of data or information are required annually. The various acts and executive orders, along with some MPO-required responsibilities, are summarized in Table 1, below.
Table 1 |
||
Federal Mandate |
Mandate Principles |
Federally Required MPO Actions |
Title VI of the Civil Rights Act of 1964 |
No person shall, on the grounds of race, color, or national origin, be excluded from participation in, be denied the benefits of, or be subjected to discrimination under any program or activity receiving federal financial assistance. |
Submit a Title VI program to MassDOT. The program must include outreach to minority and limited-English-proficiency populations and a demographic profile of the region. |
Environmental Justice Executive Order 12898, February 1994 |
Avoid, minimize, or mitigate disproportionately high and adverse human health and environmental effects on minority and low-income populations; ensure their full and fair participation in the transportation decision-making process. |
Create a demographic profile to determine where environmental justice populations are located; achieve meaningful public engagement with environmental justice populations. |
Executive Order 13166, August 2000 |
Improve access to services for LEP populations. |
Develop an LEP plan; collect data and analyze the needs of the LEP population; develop a public involvement process that seeks out and considers the needs of the LEP population. |
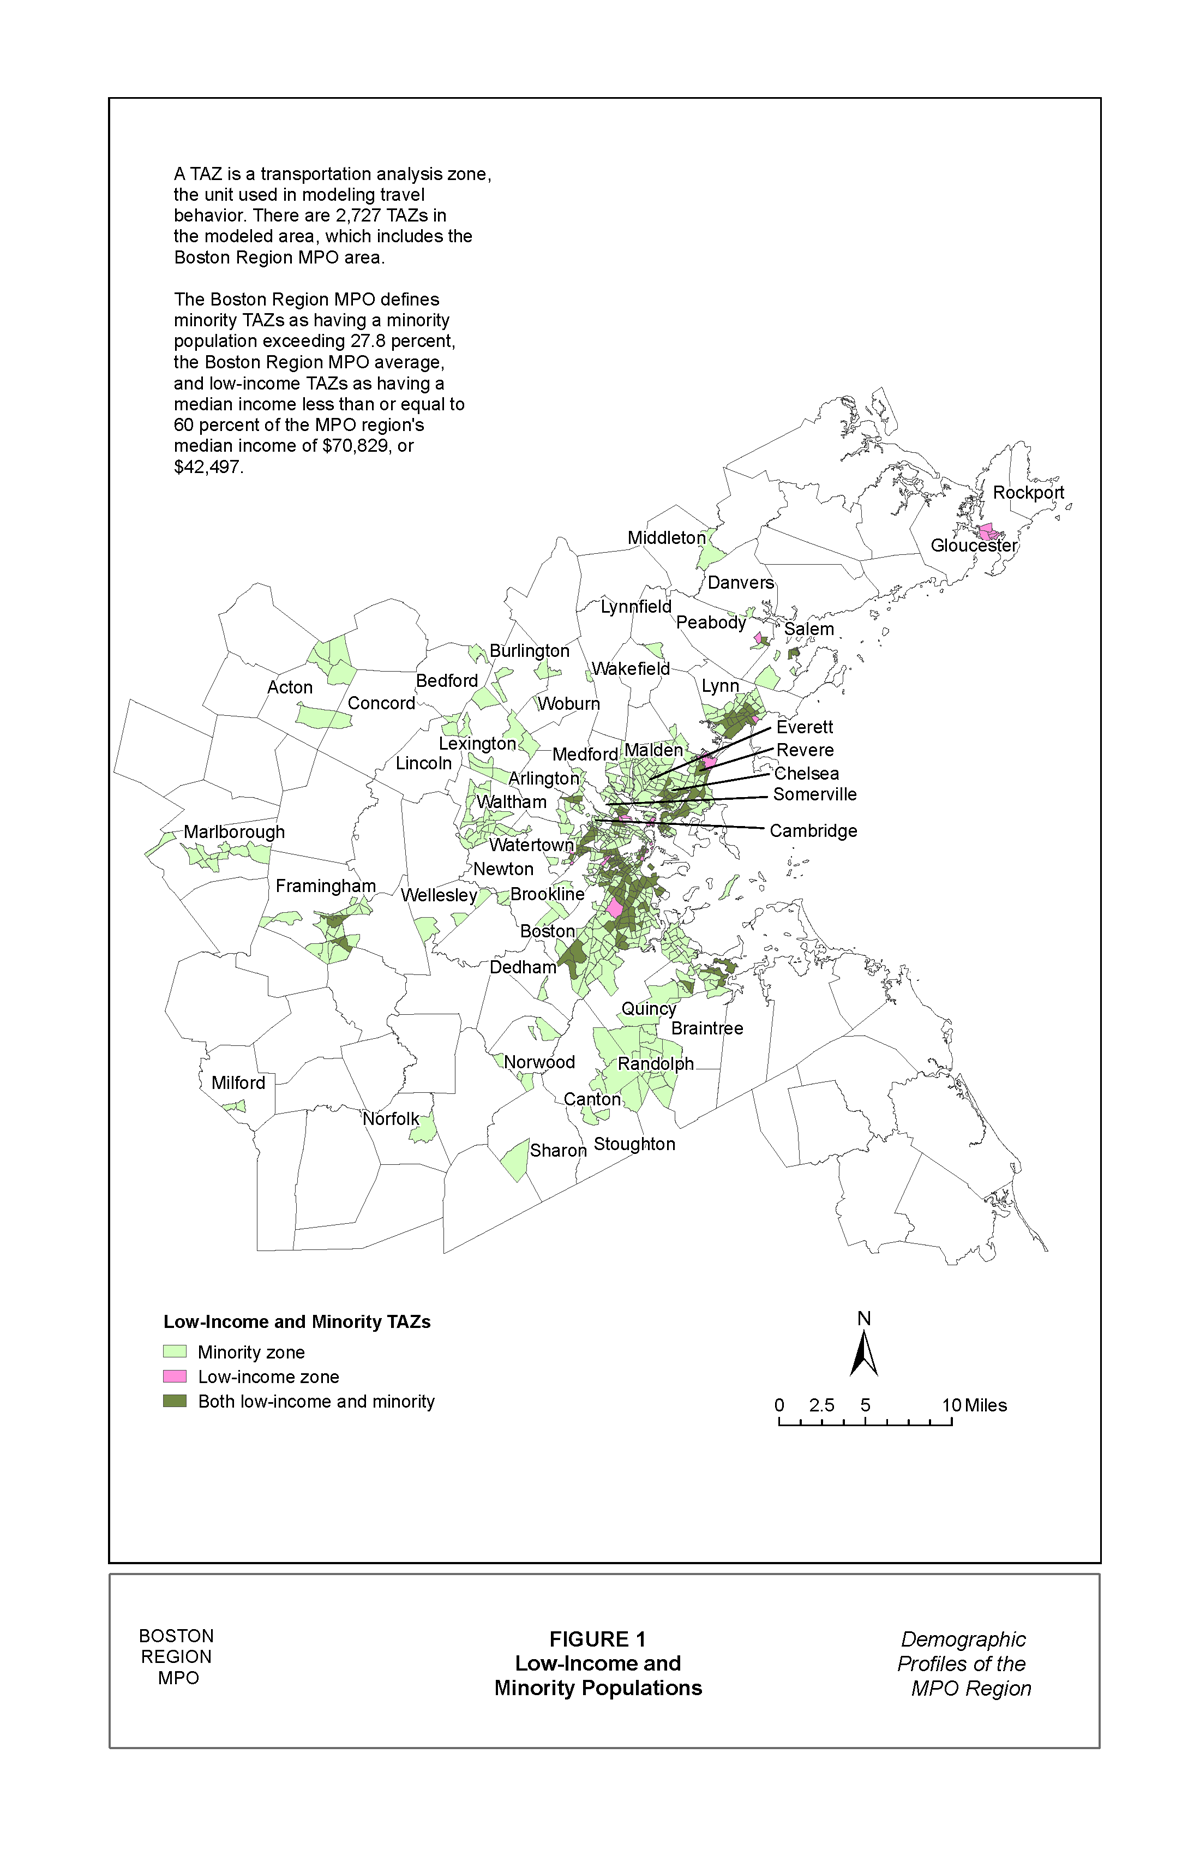
The Title VI and environmental justice circulars define a low-income person as one whose median household income is at or below the Department of Health and Human Services’ poverty guidelines. The 2012 federal poverty guideline for a family of four is $23,250. MPOs may use their own definitions or thresholds or a percentage of median income for their region as long as their definitions meet or exceed the federal definition. The Boston Region MPO has defined and continues to define a low-income threshold for an individual as a person living in a household whose median income is 60% or less than the median MPO household income. Research indicates that this is in line with thresholds used by comparable MPOs. (See the attached internal memorandum, provided in the appendix, sent to four MPO staff members in April 2012, which describes the change from using 2000 census data to using 2010 census data for the MPO’s environmental justice (EJ) criteria and Long-Range Transportation Plan [LRTP]). According to the 2010 census, the median MPO household income is $70,829, and the MPO’s low-income threshold is $42,497. This income threshold is used for all of the MPO’s Title VI reporting and for all of the environmental justice analyses conducted for the LRTP and the TIP.
The Title VI circular defines a predominantly minority area as a geographic area, such as a neighborhood, census tract, or transportation analysis zone (TAZ),1 where the proportion of minority persons residing in that area exceeds the average proportion of minority persons in the recipient’s service area.”2
For Title VI purposes, when identifying benefits and burdens of proposed transportation projects included in its LRTP and when evaluating TIP projects, the MPO has defined a minority TAZ as one whose minority population is greater than the overall MPO region’s average of 27.8%. For Transportation Equity outreach purposes, the MPO uses the definition suggested in the draft environmental justice circular, published in 2011, that “a significant minority population may be present if the minority population percentage of the affected area is ‘meaningfully greater’ than the minority population percentage in the general population or other ‘appropriate unit of geographic analysis.’"3 The draft circular suggested that a minority population greater than 50% is always “meaningfully greater.” However, the most recent federal environmental justice circular, released on July 14, 2012, does not include the suggestion that a minority population exceeding 50% is always considered meaningfully greater. Nevertheless, for transportation equity (environmental justice) outreach purposes, the MPO continues to use the minority threshold of 50% or greater as it focuses its efforts on the most heavily minority areas of the MPO region.
Federal regulations define LEP persons as persons for whom English is not the primary language and who have a limited ability to read, write, speak, or understand English. It includes people who reported in the U.S. census that they speak English not well or not at all. The federal and MPO definitions are summarized in Table 2, below.
Table 2 |
||
Low-Income |
Federal Definition |
MPO Definition |
|
Title VI and Environmental Justice: Median household income is at or below the federal poverty guidelines for a family of four or a percentage of the area’s median income, as defined by an MPO. |
Median household income is less than or equal to the MPO’s median household income (currently $42,497). |
Minority Area |
Title VI: A geographic area where the minority percentage exceeds the region’s average. Environmental Justice: An area where the minority population is meaningfully greater than the region’s average. |
Title VI: A TAZ with a minority population greater than the MPO’s average of 27.8%. Environmental Justice: Groups of TAZs where the minority population exceeds 50%. |
Information from the 2010 U.S. census, which sampled 100% of the U.S. population, was used to determine population and race by place of residence. Prior to 2010, the U.S. census used the “long form” to sample one in six households (approximately 16.7%) to determine income and linguistic information. This sample size resulted in estimates with reasonable margins of error for small geographic areas.
Since 2010, the annual American Community Survey (ACS) has been the U.S. Census Bureau’s source for income and language data. The ACS samples 1.5% of households per year. The MPO used five-year aggregate averages (2006–10) to determine income and language information. However, the much smaller sample sizes than for the long form result in larger margins of error for small geographic areas. In addition, the differences in data sources and survey methodologies make it difficult to make some longitudinal comparisons between the 2000 census data and current information.
Analysis reveals that the Boston Region MPO is home to approximately 3.2 million residents, 27.8% of whom are minorities. Table 3 shows the distribution of the population by race and the changes between 2000 and 2010. The total population increased by 3%. This growth is primarily due to the approximately 34% increase in the minority population. The Asian population, which is the fastest-growing minority population, increased by 46%. The Hispanic population, which can include people in all racial groups, increased by 48%.
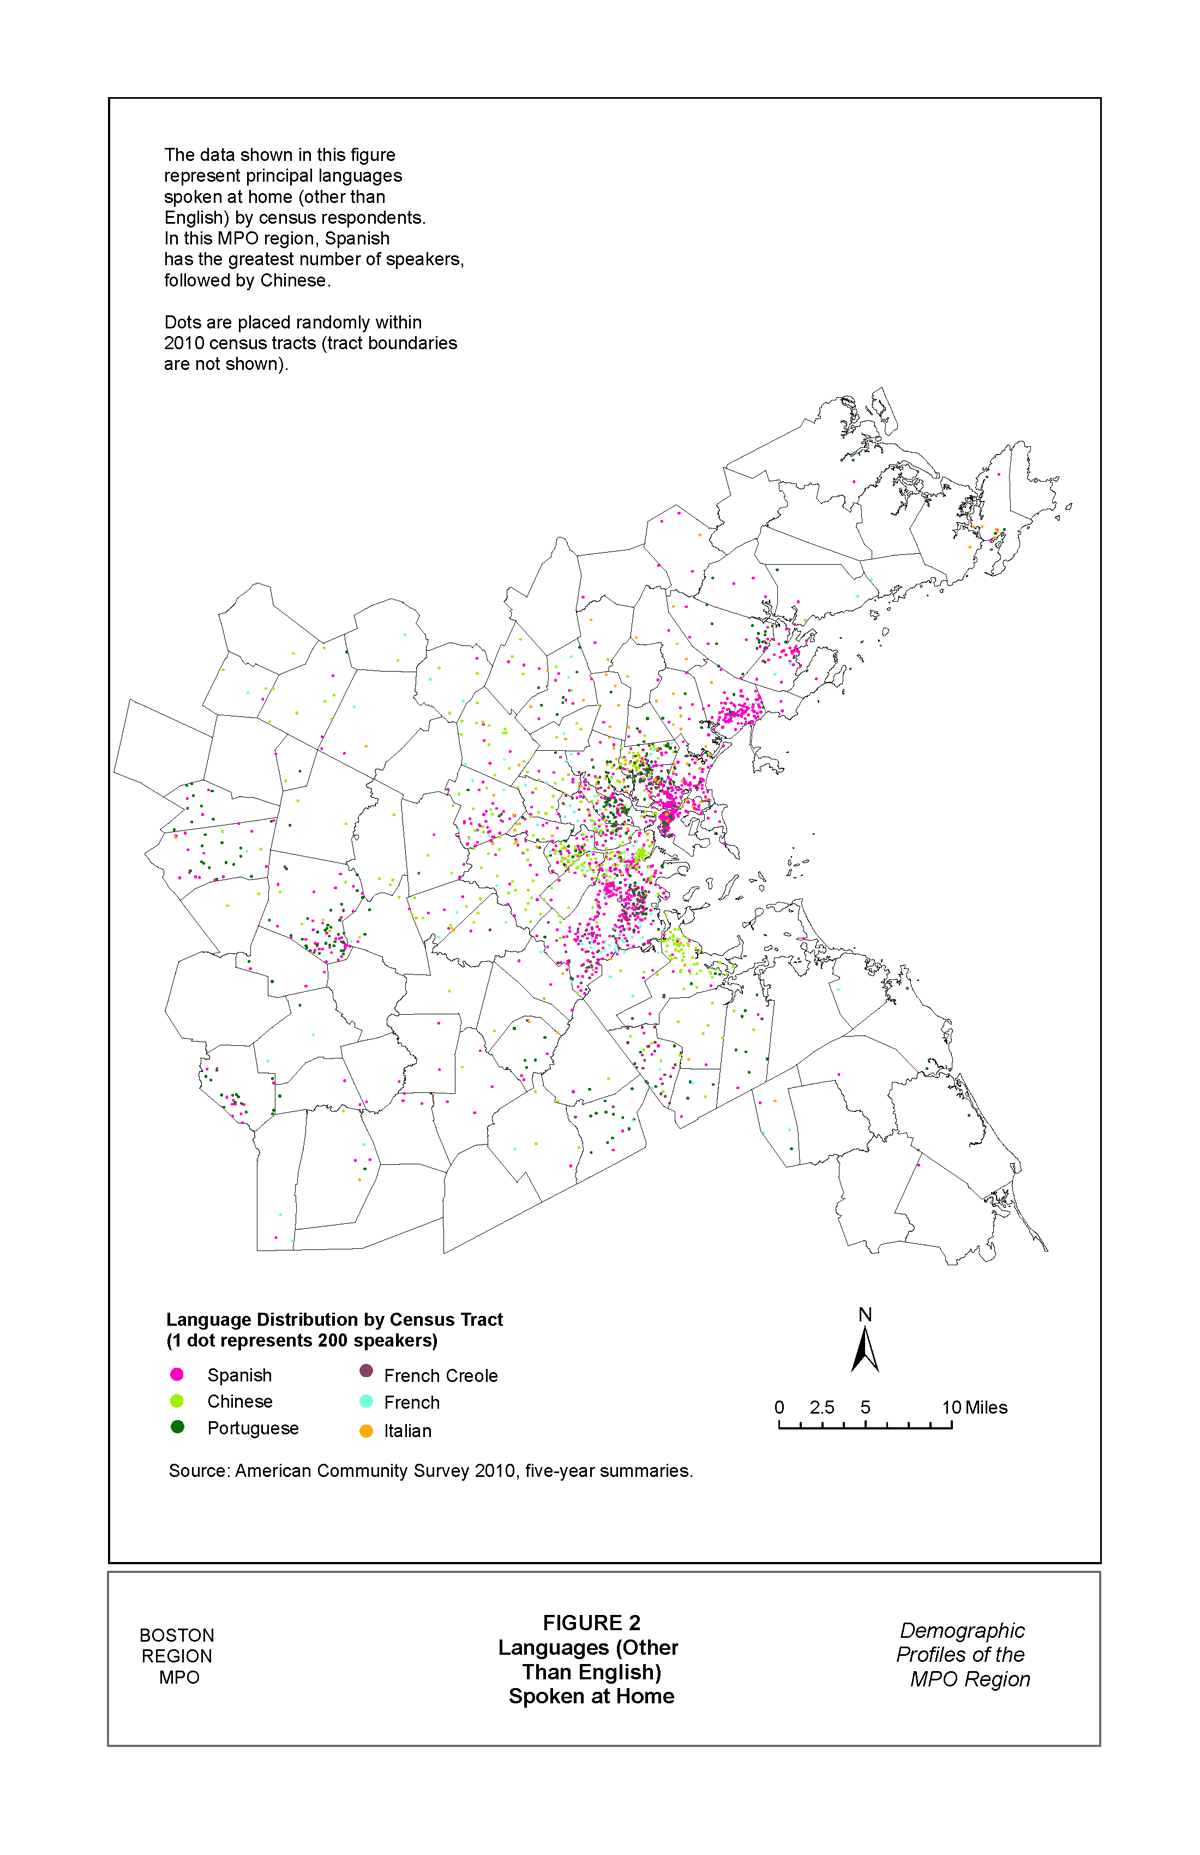
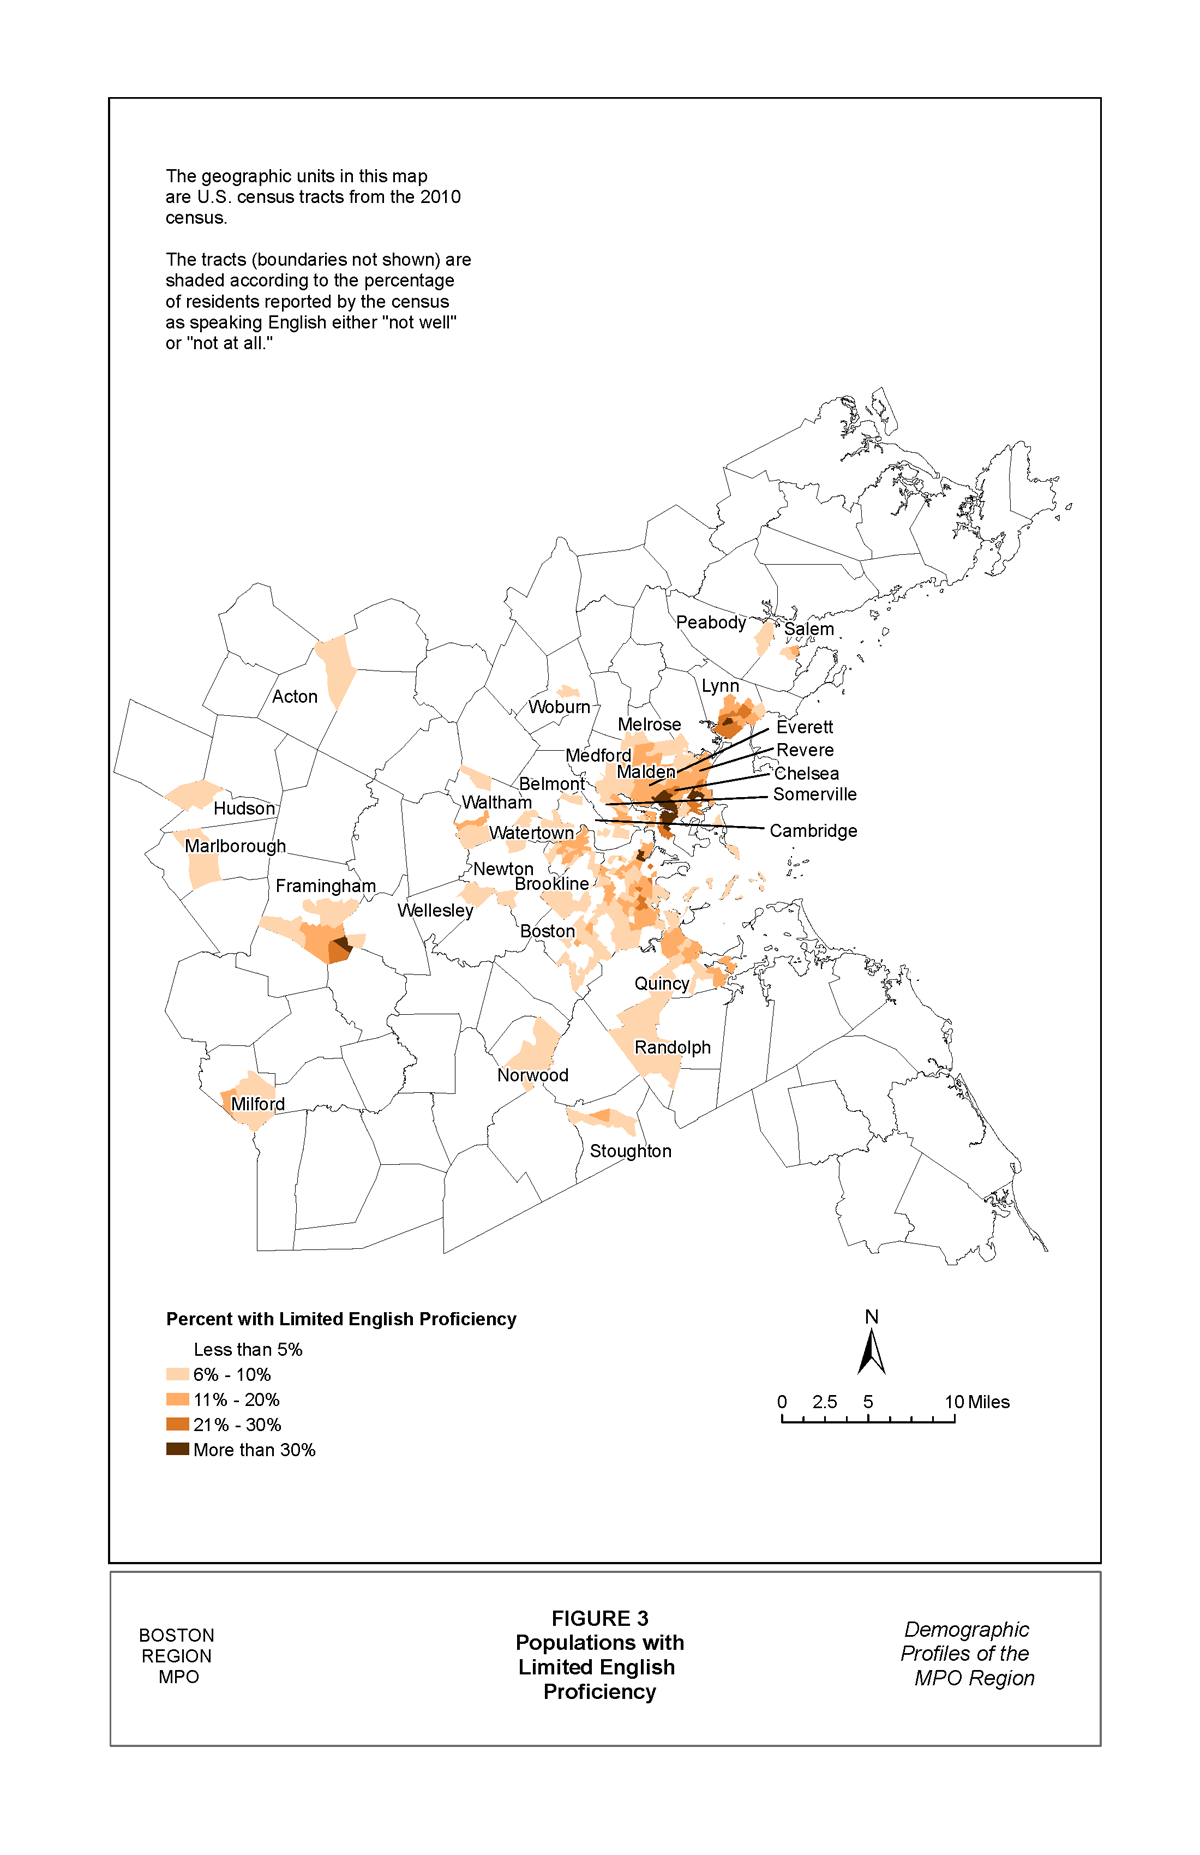
Of the nearly 3 million residents who are five years of age or older, 75.6% speak only English at home, 7.5% speak Spanish, 2.8% speak Chinese, 2.5% speak Portuguese, 1.3% speak French Creole, 1.2% speak French, and 1.1% speak Italian. Table 4 shows the changes, from 2000 to 2010, in languages spoken. Of the population aged five and older, 4.9% are considered to be limited in English proficiency because they either do not speak English well or do not speak English at all. The percentage was 4.1% in 2000.
Table 3
Racial Characteristics of the Boston Region MPO Area
Race |
2000 Population |
2010 Population |
Change 2000–10 |
2000 Percent |
2010 Percent |
Change 2000–10 |
White |
2,491,060 |
2,413,522 |
-77,538 |
81.2% |
76.3% |
-3.1% |
Black/African American |
230,357 |
272,318 |
41,961 |
7.5% |
8.6% |
18.2% |
American Indian/Alaska Native |
6,079 |
7,620 |
1,541 |
0.2% |
0.2% |
25.3% |
Asian |
164,170 |
239,629 |
75,459 |
5.4% |
7.6% |
46.0% |
Native Hawaiian and other Pacific Islanders |
1,252 |
1,051 |
201 |
0.0% |
0.0% |
-16.1% |
Other |
98,157 |
142,689 |
44,532 |
3.2% |
4.5% |
45.4% |
Two or more races |
75,319 |
84,883 |
9,564 |
2.5% |
2.7% |
12.7% |
Total |
3,066,394 |
3,161,712 |
95,318 |
100.0% |
100.0% |
3.1% |
Hispanic |
195,598 |
289,034 |
93,436 |
6.4% |
9.1% |
47.8% |
Minority* |
657,102 |
878,118 |
221,016 |
21.4% |
27.8% |
33.6% |
*Includes Hispanic Caucasians and all non-white populations. |
||||||
Table 4
Languages Spoken At Home in the Boston Region MPO Area*
Language |
2000 Population |
2010 Population |
Change 2000–10 |
2000 Percent |
2010 Percent |
Change 2000–10 |
|
English only |
2,276,807 |
2,256,341 |
-20,466 |
79.1% |
75.6% |
-0.9% |
|
Spanish |
175,751 |
225,042 |
49,291 |
6.1% |
7.5% |
28.0% |
|
Chinese |
59,883 |
84,231 |
24,348 |
2.1% |
2.8% |
40.7% |
|
Portuguese |
58,036 |
76,020 |
17,984 |
2.0% |
2.5% |
31.0% |
|
French Creole |
34,473 |
38,205 |
3,732 |
1.2% |
1.3% |
10.8% |
|
French |
34,669 |
35,584 |
915 |
1.2% |
1.2% |
2.6% |
|
Italian |
43,188 |
32,223 |
-10,965 |
1.5% |
1.1% |
-25.4% |
|
Other |
197,092 |
237,361 |
40,269 |
6.8% |
8.0% |
20.4% |
|
Total |
2,879,899 |
2,985,007 |
105,108 |
100.0% |
100.00% |
3.6% |
|
*Spoken at home by the population of people aged five years and older. |
|||||||
Low-income and minority thresholds were used to identify low-income and/or minority TAZs. (It is important to note that although Title VI relates to race and national origin, income is also used as a criterion for some Title VI programs.) Figure 1 (following the four tables at the end of this memorandum) shows the TAZs that are defined as low-income, minority, or both. These TAZs are heavily concentrated within the urban core. Of the 1,943 TAZs within the MPO region, 11% are identified as low-income, 33% as minority, and 10% as both.
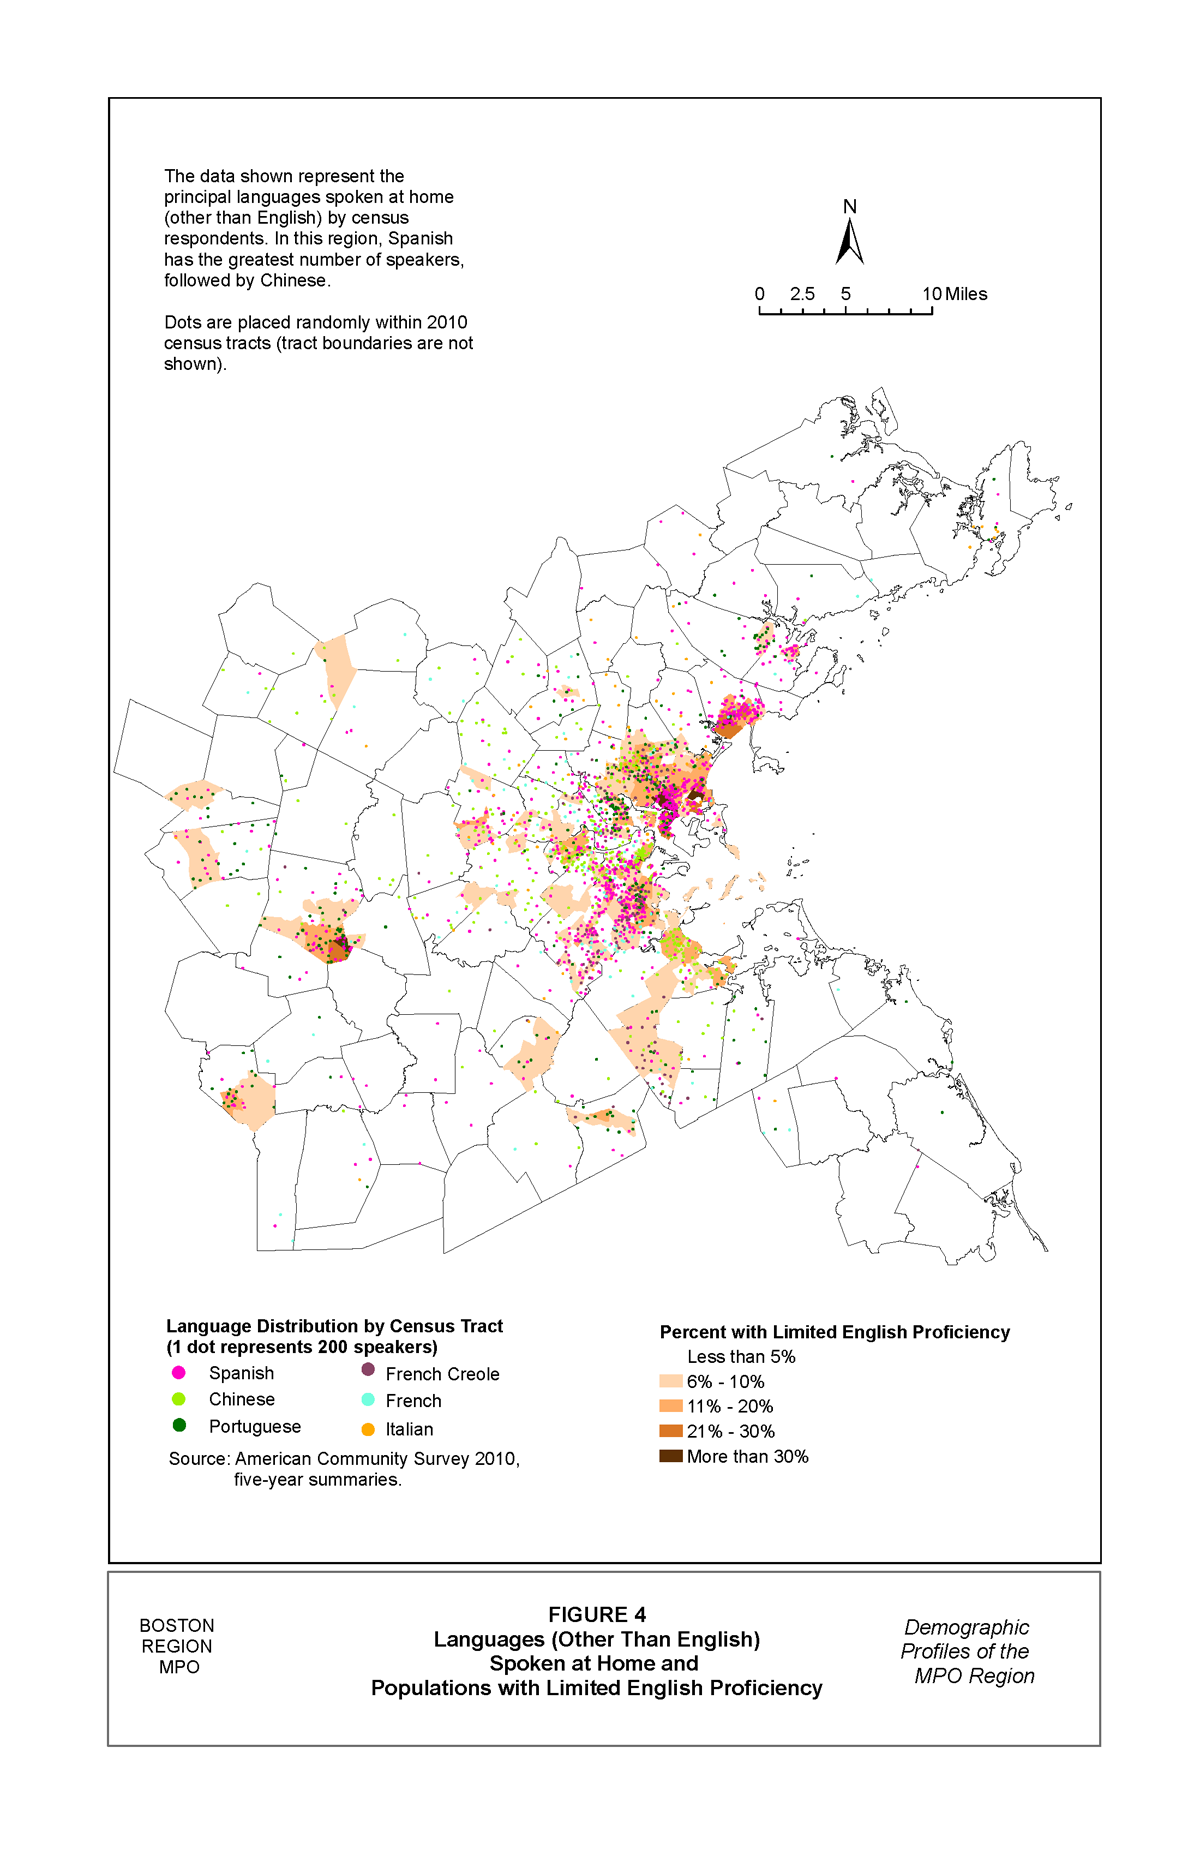
Figure 2 (at the end of this memorandum, following the tables) shows the six most frequently spoken languages, other than English, in the MPO region by census tract. Figure 3 (following the tables at the end of this memorandum) shows census tracts and their proportions of LEP populations. This information is available by TAZ, but given the small sample sizes used for the ACS, the data are not statistically significant at that level for 85% of the TAZs. Figure 4 (at the end of this memorandum), shows the languages spoken superimposed on the LEP areas. Areas where languages other than English are spoken at home do not always correspond with LEP areas, because speaking a language other than English at home does not necessarily mean that a person is not fluent in English. Data supporting the three figures will be used for Title VI purposes and to determine benefits and burdens of projects that are included in the MPO’s LRTP and TIP. The low-income data will also be used to guide transportation equity work.
Demographic data are also used to reach out to and inform low-income, minority, and LEP populations about MPO activities and documents. The threshold for defining low-income areas as having a median household income less than or equal to 60% of the MPO’s median household income is used to determine which TAZs are low-income, and this threshold is also used for outreach purposes. However, for outreach to minority areas, the MPO continues to use the 50% minority threshold.
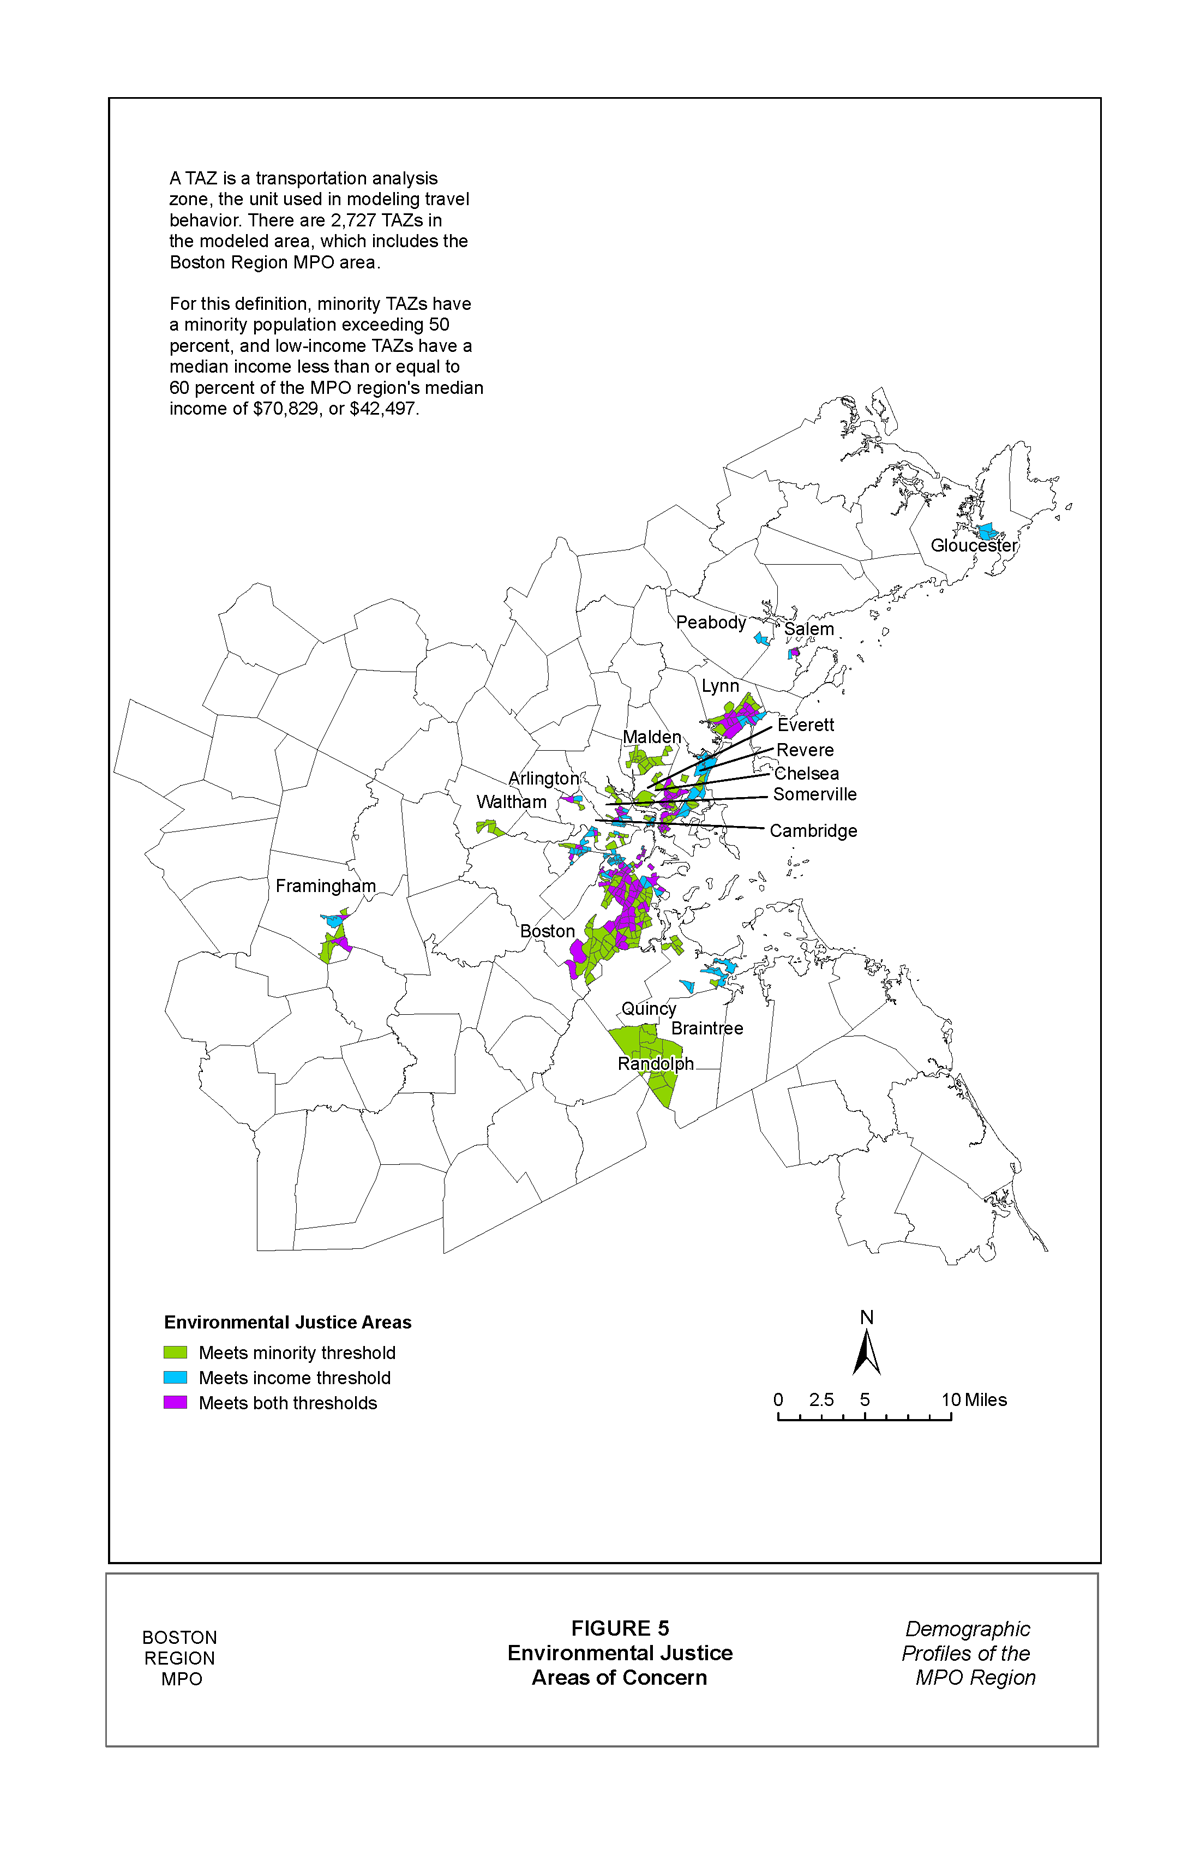
For the city of Boston, MPO staff used the Boston Redevelopment Authority’s definitions of neighborhoods to group TAZs into neighborhoods. For outreach purposes, the MPO has identified what it calls areas of concern, which are clusters of TAZs that meet the MPO’s income or minority criteria. In general, the TAZs in these clusters have to have at least 200 low-income or minority residents each. TAZs with populations that meet the thresholds and that contain group living quarters with changing populations (for example, prisons and college dorms) but small numbers of households, are excluded.
Analysis indicates that within the MPO region, there are areas of concern in 15 municipalities and 13 Boston neighborhoods. The majority of these areas of concern were previously identified using 2000 census data, with two exceptions: the demographics of Milford have changed such that the town no longer contains TAZs that are areas of concern, and Gloucester has been added to the list because it now contains several low-income TAZs.
Municipalities containing areas of concern represent 45% of the MPO’s population, 73% of the MPO’s minority population, and 82% of the LEP population. Identified areas of concern represent 20% of the MPO’s total population, 49% of the minority population, and 54% of the LEP population. These areas are shown in Figure 5 (at the end of this memorandum).
Table 5 shows the total number of TAZs and the percentage of EJ TAZs in each municipality or Boston neighborhood. Table 6 (at the end of this memorandum) presents demographic information by neighborhood and municipality that contain areas of concern. Minority populations in these municipalities and neighborhoods range from 6% of the total population in Gloucester to 95% in Mattapan. Household incomes as a percentage of the MPO median household income range from 41% to 117%. LEP populations range from 2% to 32%.
Table 7 (at the end of this memorandum) presents the same data for the areas of concern (clusters of TAZs within a municipality or neighborhood). Minority populations in these areas range from 8% to 95%. Household incomes as a percentage of the MPO median household income range from 30% to 92%. LEP populations represent 3% to 33% of the population of the areas.
To show the level of language diversity, Table 8 (at the end of this memorandum) presents languages spoken at home by residents five years of age and older in communities with areas of concern. Languages spoken at home by at least 1,000 residents within a municipality or a Boston neighborhood with an EJ area of concern are shown for illustrative purposes only. (As an example, in Charlestown, two languages other than English are spoken by slightly fewer than 1,000 residents each; however, each of those two languages is spoken by more than 5% of the neighborhood’s population.)
AW/aw
1 A transportation analysis zone is a unit of geography used in modeling transportation behavior.
2 Title VI Requirements and Guidelines for Federal Transit Administration Recipients, October 1, 2012, p. 1-5.
3 Environmental Justice Policy Guidance for Federal Transit Administration Recipients, FTA C 4703.1, September 29, 2011, p. 6.
| Table 5 | ||||||||||
| Environmental Justice Transportation Analysis Zones in the Boston Region MPO Area | ||||||||||
| Neighborhood/Municipality | Total TAZs | EJ TAZs | % EJ TAZs | |||||||
| Boston | ||||||||||
| Allston/Brighton | 46 | 17 | 37.0% | |||||||
| Charlestown | 15 | 3 | 20.0% | |||||||
| Chinatown | 10 | 9 | 90.0% | |||||||
| Dorchester | 45 | 30 | 66.7% | |||||||
| East Boston | 24 | 16 | 66.7% | |||||||
| Fenway/Kenmore | 38 | 22 | 57.9% | |||||||
| Hyde Park | 14 | 11 | 78.6% | |||||||
| Jamaica Plain | 22 | 9 | 40.9% | |||||||
| Mattapan | 15 | 15 | 100.0% | |||||||
| Roslindale | 13 | 5 | 38.5% | |||||||
| Roxbury | 30 | 28 | 93.3% | |||||||
| South Boston | 34 | 3 | 8.8% | |||||||
| South End | 24 | 10 | 41.7% | |||||||
| Cambridge | 104 | 18 | 17.3% | |||||||
| Chelsea | 23 | 17 | 73.9% | |||||||
| Everett | 18 | 4 | 22.2% | |||||||
| Framingham | 40 | 10 | 25.0% | |||||||
| Gloucester | 15 | 4 | 26.7% | |||||||
| Lynn | 39 | 25 | 64.1% | |||||||
| Malden | 30 | 15 | 50.0% | |||||||
| Medford | 29 | 1 | 3.4% | |||||||
| Peabody | 26 | 2 | 7.7% | |||||||
| Quincy | 52 | 13 | 25.0% | |||||||
| Randolph | 15 | 14 | 93.3% | |||||||
| Revere | 24 | 8 | 33.3% | |||||||
| Salem | 19 | 2 | 10.5% | |||||||
| Somerville | 46 | 12 | 26.1% | |||||||
| Waltham | 38 | 5 | 13.2% | |||||||
| Total | 848 | 328 | 38.7% | |||||||
| Table 6 | ||||||
| Demographics of Municipalities and Boston Neighborhoods | ||||||
| with Environmental Jusfice Areas of Concern | ||||||
| Municipality/ Neighborhood with Areas of Concern | Total Population | Minority Population | % Minority Population | Median HH* Income as a % of MPO Median HH Income | LEP** Population | % LEP** |
| Boston | ||||||
| Allston/Brighton | 74,998 | 25,428 | 33.9% | 68.1% | 6,114 | 8.4% |
| Charlestown | 16,439 | 3,982 | 24.2% | 117.6% | 930 | 6.1% |
| Chinatown | 7,388 | 4,887 | 66.1% | 37.6% | 1,684 | 23.5% |
| Dorchester | 87,014 | 61,932 | 71.2% | 66.3% | 9,410 | 11.6% |
| East Boston | 40,508 | 25,457 | 62.8% | 60.4% | 11,964 | 32.0% |
| Fenway/Kenmore | 41,597 | 14,275 | 34.3% | 40.6% | 1,435 | 3.5% |
| Hyde Park | 37,990 | 28,195 | 74.2% | 79.9% | 2,178 | 6.1% |
| Jamaica Plain | 39,233 | 18,237 | 46.5% | 78.0% | 2,499 | 6.7% |
| Mattapan | 34,301 | 32,661 | 95.2% | 60.8% | 1,925 | 6.0% |
| Roslindale | 31,054 | 15,349 | 49.4% | 87.3% | 2,431 | 8.4% |
| Roxbury | 61,618 | 56,659 | 92.0% | 43.9% | 5,892 | 10.3% |
| South Boston | 33,688 | 7,136 | 21.2% | 90.3% | 1,552 | 4.8% |
| South End | 33,577 | 17,226 | 51.3% | 63.0% | 3,758 | 11.8% |
| Cambridge | 106,345 | 40,297 | 37.9% | 91.6% | 3,197 | 3.2% |
| Chelsea | 35,178 | 26,295 | 74.7% | 57.2% | 8,426 | 26.2% |
| Everett | 41,667 | 19,351 | 46.4% | 70.2% | 5,216 | 13.4% |
| Framingham | 68,321 | 23,696 | 34.7% | 90.4% | 6,009 | 9.4% |
| Gloucester | 28,789 | 1,689 | 5.9% | 85.4% | 573 | 2.1% |
| Lynn | 90,330 | 47,360 | 52.4% | 61.0% | 10,215 | 12.2% |
| Malden | 59,451 | 28,238 | 47.5% | 79.6% | 5,324 | 9.6% |
| Medford | 56,173 | 13,384 | 23.8% | 99.0% | 2,179 | 4.1% |
| Peabody | 51,252 | 6,317 | 12.3% | 92.5% | 1,647 | 3.4% |
| Quincy | 92,272 | 31,822 | 34.5% | 84.4% | 6,863 | 7.9% |
| Randolph | 32,111 | 19,559 | 60.9% | 91.2% | 2,000 | 6.6% |
| Revere | 51,755 | 19,456 | 37.6% | 70.3% | 5,998 | 12.4% |
| Salem | 41,340 | 9,964 | 24.1% | 80.4% | 1,993 | 5.1% |
| Somerville | 75,754 | 23,396 | 30.9% | 87.2% | 3,341 | 4.6% |
| Waltham | 60,632 | 18,954 | 31.3% | 93.7% | 2,872 | 5.0% |
| Total | 1,430,775 | 641,202 | 44.8% | 117,625 | 8.2% | |
| % of MPO Total | 45.3% | 73.0% | 82.5% | |||
| *HH = household | ||||||
| **LEP = limited English proficiency | ||||||
| Table 7 | ||||||
| Demographics of Environmental Justice Areas of Concern | ||||||
| Location of Areas of Concern | Total Population | Minority Population | % Minority Population | Median HH* Income as a % of MPO Median HH Income | LEP** Population | % LEP** |
| Boston Neighborhoods | ||||||
| Allston/Brighton | 27,784 | 12,058 | 43.4% | 52.6% | 2,587 | 9.7% |
| Charlestown | 5,237 | 2,960 | 56.5% | 62.5% | 626 | 13.0% |
| Chinatown | 7,388 | 4,887 | 66.1% | 37.6% | 1,684 | 23.5% |
| Dorchester | 70,566 | 56,442 | 80.0% | 62.2% | 8,494 | 12.9% |
| East Boston | 35,977 | 23,684 | 65.8% | 59.1% | 10,834 | 32.7% |
| Fenway/Kenmore | 29,735 | 11,147 | 37.5% | 41.3% | 1,110 | 4.1% |
| Hyde Park | 31,065 | 25,026 | 80.6% | 78.1% | 1,814 | 6.3% |
| Jamaica Plain | 20,592 | 13,219 | 64.2% | 50.1% | 1,789 | 9.2% |
| Mattapan | 34,301 | 32,661 | 95.2% | 60.8% | 1,925 | 6.0% |
| Roslindale | 11,732 | 8,636 | 73.6% | 72.8% | 1,168 | 10.7% |
| Roxbury | 60,476 | 56,376 | 93.2% | 43.8% | 5,709 | 10.2% |
| South Boston | 8,188 | 5,281 | 64.5% | 30.0% | 1,216 | 16.1% |
| South End | 18,453 | 12,567 | 68.1% | 42.9% | 2,607 | 15.0% |
| Cambridge | 29,530 | 16,948 | 57.4% | 63.1% | 1,224 | 4.4% |
| Chelsea | 32,671 | 25,335 | 77.5% | 56.2% | 8,182 | 27.5% |
| Everett | 9,018 | 4,772 | 52.9% | 72.0% | 1,219 | 14.6% |
| Framingham | 18,829 | 11,544 | 61.3% | 58.6% | 3,160 | 18.2% |
| Gloucester | 7,241 | 562 | 7.8% | 55.1% | 219 | 3.2% |
| Lynn | 57,893 | 38,155 | 65.9% | 49.5% | 8,930 | 16.8% |
| Malden | 30,598 | 17,252 | 56.4% | 77.8% | 3,018 | 10.6% |
| Medford | 590 | 406 | 68.8% | 84.7% | 44 | 8.5% |
| Peabody | 3,570 | 931 | 26.1% | 54.0% | 254 | 7.5% |
| Quincy | 20,264 | 10,486 | 51.7% | 68.2% | 2,174 | 11.4% |
| Randolph | 31,859 | 19,478 | 61.1% | 91.9% | 1,985 | 6.6% |
| Revere | 17,399 | 8,519 | 49.0% | 65.0% | 2,756 | 17.0% |
| Salem | 4,408 | 2,587 | 58.7% | 55.7% | 564 | 13.9% |
| Somerville | 14,872 | 8,061 | 54.2% | 58.5% | 1,495 | 10.9% |
| Waltham | 8,877 | 4,682 | 52.7% | 79.3% | 321 | 5.7% |
| Total | 649,113 | 434,662 | 67.0% | 77,108 | 11.9% | |
| % of MPO Total | 20.5% | 49.5% | 54.1% | |||
| *HH = household | ||||||
| **LEP = limited English proficiency | ||||||
| Table 8 | ||||||||
| Languages Spoken at Home by Residents Aged Five and Older in Municipalities and Neighborhoods with Areas of Concern | ||||||||
| Allston/Brighton | Cambridge | Charlestown | ||||||
| Language Spoken | Speakers | % Total | Language Spoken | Speakers | % Total | Language Spoken | Speakers | % Total |
| Only English | 48,170 | 66.1% | Only English | 67,676 | 67.2% | Only English | 12,657 | 82.5% |
| Chinese | 5,429 | 7.5% | Spanish | 5,988 | 5.9% | Chinese | 949 | 6.2% |
| Spanish | 5,407 | 7.4% | Chinese | 5,515 | 5.5% | Spanish | 914 | 6.0% |
| Russian | 2,863 | 3.9% | French Creole | 2,671 | 2.7% | Percent Total | 94.7% | |
| Portuguese | 2,429 | 3.3% | French | 2,133 | 2.1% | |||
| Percent Total | 88.3% | Portuguese | 1,402 | 1.4% | ||||
| Italian | 1,004 | 1.0% | ||||||
| Percent Total | 85.8% | |||||||
| Chelsea | Chinatown | Dorchester | ||||||
| Language Spoken | Speakers | % Total | Language Spoken | Speakers | % Total | Language Spoken | Speakers | % Total |
| Spanish | 17,507 | 54.5% | Only English | 3,489 | 48.8% | Only English | 47,154 | 57.9% |
| Only English | 10,810 | 33.7% | Chinese | 2,569 | 35.9% | Spanish | 10,825 | 13.3% |
| Percent Total | 88.2% | Percent Total | 84.7% | Vietnamese | 7,063 | 8.7% | ||
| Portuguese | 4,973 | 6.1% | ||||||
| French Creole | 4,271 | 5.2% | ||||||
| French | 1,538 | 1.9% | ||||||
| Percent Total | 93.1% | |||||||
| East Boston | Everett | Fenway/Kenmore | ||||||
| Language Spoken | Speakers | % Total | Language Spoken | Speakers | % Total | Language Spoken | Speakers | % Total |
| Spanish | 18,301 | 48.9% | Only English | 21,761 | 56.1% | Only English | 29,548 | 71.7% |
| Only English | 12,442 | 33.3% | Spanish | 5,847 | 15.1% | Spanish | 2,789 | 6.8% |
| Portuguese | 1,995 | 5.3% | Portuguese | 4,716 | 12.2% | Chinese | 2,262 | 5.5% |
| Italian | 1,535 | 4.1% | French Creole | 2,412 | 6.2% | Percent Total | 83.9% | |
| Percent Total | 91.6% | Italian | 1,231 | 3.2% | ||||
| Percent Total | 92.7% | |||||||
| Framingham | Gloucester | Hyde Park | ||||||
| Language Spoken | Speakers | % Total | Language Spoken | Speakers | % Total | Language Spoken | Speakers | % Total |
| Only English | 41,333 | 64.8% | Only English | 24,569 | 89.3% | Only English | 21,603 | 60.9% |
| Portuguese | 7,644 | 12.0% | Italian | 1,219 | 4.4% | Spanish | 5,792 | 16.3% |
| Spanish | 7,539 | 11.8% | Percent Total | 93.8% | French Creole | 4,228 | 11.9% | |
| Percent Total | 88.6% | Percent Total | 89.1% | |||||
| Jamaica Plain | Lynn | Malden | ||||||
| Language Spoken | Speakers | % Total | Language Spoken | Speakers | % Total | Language Spoken | Speakers | % Total |
| Only English | 25,184 | 67.8% | Only English | 49,903 | 59.7% | Only English | 29,129 | 52.3% |
| Spanish | 5,999 | 16.1% | Spanish | 21,151 | 25.3% | Chinese | 5,703 | 10.2% |
| Chinese | 1,750 | 4.7% | Mon / Khmer | 2,666 | 3.2% | Portuguese | 4,221 | 7.6% |
| Percent Total | 88.6% | Russian | 1,469 | 1.8% | Spanish | 4,156 | 7.5% | |
| Greek | 1,417 | 1.7% | French Creole | 2,702 | 4.9% | |||
| Percent Total | 91.6% | Vietnamese | 1,305 | 2.3% | ||||
| Italian | 1,099 | 2.0% | ||||||
| Percent Total | 86.8% | |||||||
| Mattapan | Medford | Peabody | ||||||
| Language Spoken | Speakers | % Total | Language Spoken | Speakers | % Total | Language Spoken | Speakers | % Total |
| Only English | 21,052 | 66.0% | Only English | 39,309 | 73.8% | Only English | 39,213 | 80.4% |
| Spanish | 4,193 | 13.1% | Italian | 2,191 | 4.1% | Portuguese | 3,203 | 6.6% |
| French Creole | 3,005 | 9.4% | Portuguese | 2,021 | 3.8% | Spanish | 2,172 | 4.5% |
| French | 1,944 | 6.1% | French Creole | 1,855 | 3.5% | Greek | 1,400 | 2.9% |
| Percent Total | 94.7% | Spanish | 1,740 | 3.3% | Percent Total | 94.3% | ||
| Chinese | 1,481 | 2.8% | ||||||
| Percent Total | 91.3% | |||||||
| Quincy | Randolph | Revere | ||||||
| Language Spoken | Speakers | % Total | Language Spoken | Speakers | % Total | Language Spoken | Speakers | % Total |
| Only English | 60,352 | 69.1% | Only English | 19,425 | 64.2% | Only English | 28,390 | 58.5% |
| Chinese | 12,096 | 13.9% | French Creole | 3,677 | 12.2% | Spanish | 10,268 | 21.1% |
| Spanish | 1,994 | 2.3% | Vietnamese | 1,320 | 4.4% | Italian | 1,990 | 4.1% |
| Vietnamese | 1,786 | 2.0% | Spanish | 1,191 | 3.9% | Portuguese | 1,900 | 3.9% |
| Portuguese | 1,452 | 1.7% | Chinese | 1,164 | 3.8% | Arabic | 1,862 | 3.8% |
| Percent Total | 89.0% | Portuguese | 1,160 | 3.8% | Percent Total | 91.5% | ||
| Percent Total | 92.4% | |||||||
| Roslindale | Roxbury | Salem | ||||||
| Language Spoken | Speakers | % Total | Language Spoken | Speakers | % Total | Language Spoken | Speakers | % Total |
| Only English | 17,340 | 59.7% | Only English | 33,952 | 59.4% | Only English | 29,312 | 75.1% |
| Spanish | 5,766 | 19.9% | Spanish | 14,569 | 25.5% | Spanish | 5,205 | 13.3% |
| French Creole | 1,603 | 5.5% | French Creole | 2,575 | 4.5% | Percent Total | 88.4% | |
| Percent Total | 85.1% | Portuguese | 2,081 | 3.6% | ||||
| Percent Total | 93.1% | |||||||
| Somerville | South Boston | South End | ||||||
| Language Spoken | Speakers | % Total | Language Spoken | Speakers | % Total | Language Spoken | Speakers | % Total |
| Only English | 48,384 | 67.0% | Only English | 25,893 | 80.5% | Only English | 19,906 | 62.6% |
| Portuguese | 6,455 | 8.9% | Spanish | 2,278 | 7.1% | Spanish | 5,421 | 17.0% |
| Spanish | 6,350 | 8.8% | Percent Total | 87.5% | Chinese | 2,865 | 9.0% | |
| Chinese | 1,716 | 2.4% | Percent Total | 88.6% | ||||
| French Creole | 1,059 | 1.5% | ||||||
| Percent Total | 88.5% | |||||||
| Waltham | ||||||||
| Language Spoken | Speakers | % Total | ||||||
| Only English | 38,735 | 67.4% | ||||||
| Spanish | 6,457 | 11.2% | ||||||
| Chinese | 1,748 | 3.0% | ||||||
| Hindi | 1,215 | 2.1% | ||||||
| French | 1,159 | 2.0% | ||||||
| Percent Total | 85.8% | |||||||
Memorandum
Date April 10, 2012
TO: MPO Staff Who Conduct Title VI and Environmental Justice Analyses
FROM: Alicia Wilson, MPO Staff
RE: Defining Low-Income Levels for Transportation Equity Outreach, Environmental Justice Analyses, and Long-Range Transportation Plan Analyses
The Boston Region Metropolitan Planning Organization (MPO) currently performs analyses to comply with federal Title VI and environmental justice requirements. The Title VI circular defines a low-income person as one whose median household income is at or below the Department of Health and Human Services’ poverty guidelines.4The circular defines a predominantly minority area as a geographic area, such as a neighborhood, census tract, or transportation analysis zone (TAZ), “where the proportion of minority persons residing in that area exceeds the average proportion of minority persons in the recipient’s service area.”5
The environmental justice (EJ) circular’s low-income definition is the same as that for Title VI.6 In terms of defining a predominantly minority area. the circular states:
In order to determine whether EJ populations will be affected by a proposed program, project or activity, you first need to determine the presence of these populations. The existing guidance from CEQ [Council on Environmental Quality], EPA [Environmental Protection Agency] and others suggest that a minority population may be present if the minority population percentage of the affected area is "meaningfully greater" than the minority population percentage in the general population or other ‘appropriate unit of geographic analysis.
CEQ suggests, and FTA agrees, that minority populations will always be “meaningfully greater” when the percentage of minorities exceeds 50 percent, regardless of what the percentage of minority populations is in the comparison geographic unit.
The MPO uses an income threshold based on a March 2000 U.S. Department of Housing and Urban Development report7 and the minority threshold cited in the circular when complying with Title VI and conducting Title VI analyses. For EJ outreach and accessibility analysis for the Long-Range Transportation Plan (LRTP), the MPO follows the EJ circular’s suggestion that the minority population is always “meaningfully greater” when it exceeds 50% of the population of a TAZ. The MPO uses the regional minority average for other analyses for the LRTP. Two different income definitions are used for EJ analyses. The first one is used for outreach to low-income and minority communities and for accessibility analysis in the LRTP. The second is used for mobility, congestion, and environmental analyses to determine benefits and burdens to environmental justice populations in the LRTP. The current definitions are:
EJ Area (for outreach and accessibility analysis)
An environmental justice area is defined as one or more TAZs that both (1) have a total minority (non-white or Hispanic) population of over 200 residents, and (2) meet one or both of the following criteria:
EJ Population Zone (for mobility, congestion, and environmental analysis)
An environmental justice zone is defined as one or more TAZs that meet one or both of the following criteria:
Now that we have both the 2010 census data and the 2006–10 American Community Survey income data, it is time to reassess the MPO thresholds. Before establishing new thresholds, research on those used by other MPOs and agencies was undertaken. The following discussion lists the findings.
The Massachusetts Executive Office of Energy and Environmental Affairs (EOEEA) established the following thresholds based on the 2000 census (thresholds have yet to be updated with 2010 census data):
The income threshold of the Massachusetts Low-Income Home Energy Assistance Programs (LIHEAP) is 60% of the estimated state median household income for a family of four.
EJ minority and income thresholds (based on the 2000 census) used by five other MPOs in eastern Massachusetts were examined.
The Southeastern Regional Planning and Economic Development District (SRPED) and the Central Massachusetts Regional Planning Commission (CMRPC) use EOEEA definitions.
Old Colony’s thresholds are 25.9% minority and household income below the federal poverty level.
Northern Middlesex Council of Governments’ (NMCOG’s) minority threshold is based on average levels in their region. They seem to use several different low-income definitions, including 60% of median household income, 60% of per capita income, and 60% of median family income.
Merrimac Valley Planning Commission’s (MVPC’s) thresholds are unclear.
Delaware Valley Regional Planning Commission (DVRPC), Philadelphia, Camden, Trenton Region) – The minority threshold is based on their region average (25%).Thelow-income threshold is based on the federalpoverty guidelines for a family of four.
Metropolitan Transportation Commission (MTC), San Francisco Bay Area – The minority threshold is based on the region’s average (70%). The low-income threshold is 200% of the federal poverty level for a family of 4.
Metropolitan Washington Council of Governments, Washington, D.C. and parts of Maryland and Virginia – The minority threshold is based on the regional average for each group. The low-income threshold is 150% of the federal poverty level for a family of 4.
New York Metropolitan Transportation Council (NYMTC), New York City, Long Island, and the Lower Hudson Valley – The minority threshold is more than 50% of the population. The low-income threshold is 150% of the federal poverty level.
Southern California Association of Governments (SCAG), six counties and 191 cities in Southern California – The minority threshold is more than the regional average of 65%. The low-income threshold is based on the federal poverty level for the average regional household size (rounded to three in 2010).
The MPO’s low-income threshold of 60% of the MPO region’s median household income reflects local conditions more than the federal poverty guidelines. The following table shows that when 2000 census values were used, the MPO was in line with or exceeded the income thresholds used by most agencies examined, including those in areas with a high cost of living.
2000 Income Thresholds Used for Environmental Justice Analysis |
|||
Agency |
Low-Income Threshold |
2000 Dollars |
Agencies |
Old Colony, DVRPC |
Federal poverty level for a family of 4 |
$17,050 |
2 |
SCAG |
Federal poverty level for area's average household size |
$14,150 |
1 |
MWCOG, NYMTC |
150% of the federal poverty level for a family of 4 |
$25,575 |
2 |
MTC |
200% of the federal poverty level for a family of 4 |
$34,100 |
1 |
Boston Region, |
60% of area median household income |
$33,480* |
3 |
EOEA, SERTA, |
65% of area median household income |
$32,826** |
3 |
*Boston Region median household income. |
|||
**Massachusetts median household income. |
|||
AW/aw
4 Title VI Requirements and Guidelines for Federal Transit Administration Recipients, September 29, 2011, p. 1-3.
5 Ibid. p. 1-5.
6 Federal Transit Administration, Environmental Justice Policy Guidance for Federal Transit Administration Recipients, FTA C 4703.1, September 29, 2011, p. 6.
7 Office of Policy Development and Research of the U.S. Department of Housing and Urban Development, Rental Housing Assistance – The Worsening Crisis: A Report to Congress on Worst Case Housing Needs, March 20020, p. 99.