Memorandum
Date December 20, 2012 (Revised January 10, 2013)
To Boston Region Metropolitan Planning Organization
From Sean Pfalzer, Transportation Improvement Program Manager
MPO Staff
Re Review of the TIP Project Evaluation Criteria
The Metropolitan Planning Organization (MPO) uses Transportation Improvement Program (TIP) project evaluation criteria to make the process of analyzing and selecting projects for Regional Highway Discretionary (“Target”) Funding more logical and transparent. The criteria are designed to identify projects that will help the region attain the vision’s established by the MPO in its Long-Range Transportation Plan (LRTP). They are a tool that will help the MPO achieve its performance goals, goals that will be developed over the coming months in preparation for implementation of the new highway authorization bill, Moving Ahead for Progress in the 21st Century (MAP-21).
As part of the TIP development process, MPO staff conduct an annual review of the TIP evaluation criteria to address issues that arise during the evaluation process and concerns raised by members of the public during outreach efforts. During the development cycles of the federal fiscal years (FFYs) 2012-15 TIP and FFYs 2013-16 TIP, participants engaged in extensive correspondence and offered their input on the project evaluation criteria. Some comments raised concerns that the project evaluation criteria:
In addition to addressing these public comments on the evaluation criteria, MPO staff must prepare for the implementation of MAP-21, which emphasizes performance-based planning and requires that the TIP be developed using a performance-driven outcome-based approach. Thus, the TIP will have to demonstrate how projects will make progress toward achieving the performance targets established in the LRTP.
This memorandum describes MPO staff’s annual review of the project evaluation criteria and seeks to identify opportunities for improvement. This memorandum will provide an overview of the TIP development process and the role of the evaluation criteria in project selection. Next, it will discuss the results of the project evaluation criteria by policy category. Then, this memo will respond to the concerns raised about the project evaluation criteria during the past two development cycles. Lastly, it will highlight opportunities to prepare for future performance-based planning under MAP-21.
To decide how to spend the Target Program funds, the Boston Region MPO engages its 101 cities and towns in an annual project selection process. The four main phases of the project selection process are described below.
Outreach and Data Collection
The outreach process begins in December when MPO staff solicits a listing of priority projects to be considered for federal funding from each of the 101 cities and towns in the region. The MPO also seeks input from interested parties and members of the general public. This outreach allows MPO staff to compile a complete list of projects to be considered by the MPO for TIP Target funding. This list of projects, known as the Universe of Projects list, consists of all identified projects, including projects only in the conceptual stage as well as others that are fully designed and ready to be advertised for construction. MPO staff and municipal TIP contacts coordinate to gather and update information on each project’s scope, infrastructure condition and needs, and development status.
Project Evaluation
The next step of the project selection process is to determine which projects will be most effective at attaining the MPO’s visions and policies; here the criteria serve as a useful tool. The criteria also allow municipalities to judge the likelihood that their project will receive TIP Target Program funding. The TIP evaluation criteria are based on the visions and policies adopted by the MPO during the development of its LRTP, Paths to a Sustainable Region. The criteria evaluate how well each project’s components and outcomes advance the goals of the MPO. For example, the criteria evaluate how well each project improves pavement and signal condition to advance the MPO’s goal of maintaining a state of good repair. To support the MPO’s goal of providing safe transportation for all modes, the criteria evaluate how each project improves safety for automobiles, freight, bicyclists, and pedestrians. To support the goal of reducing greenhouse gases, the criteria evaluate how well projects reduce automobile dependency by providing improved transit access, new bicycle facilities, or new pedestrian facilities.
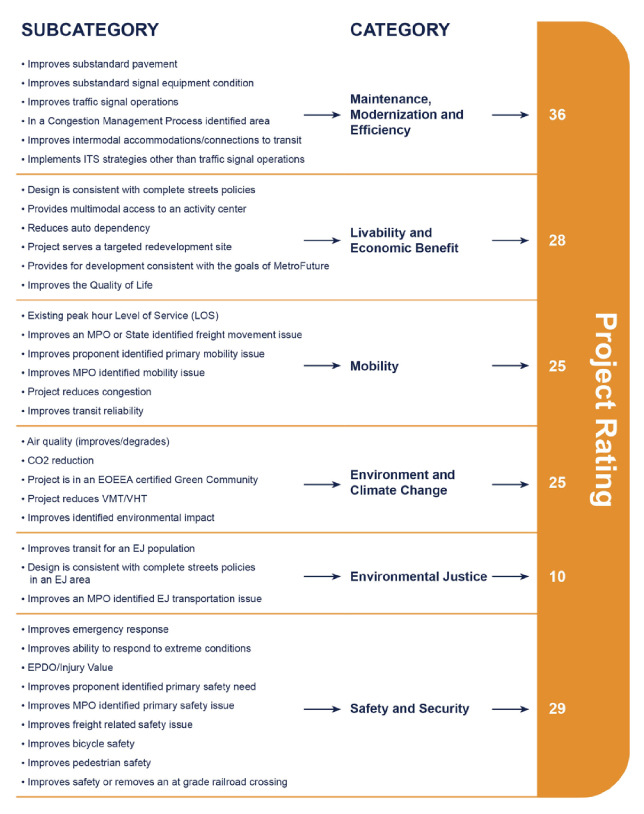
The project evaluation criteria consist of 35 questions ranging across the six policy categories listed in Figure 1. The possible points that a project can score is roughly the same for most of the policy categories, except for Environmental Justice and System Preservation, Modernization and Efficiency. There are fewer possible points in the Environmental Justice category because most projects are not eligible to score points in this category. Only projects located within a quarter mile of an environmental justice (EJ) area can score points in this category. In regards to System Preservation,
Figure 1
TIP Project Evaluation Criteria
Modernization, and Efficiency, the MPO recognizes the backlog of state-of-good-repair needs and values maintenance of the existing transportation system. In the development of the TIP criteria, the MPO doubled the value of the System Preservation, Modernization, and Efficiency points to reflect this priority. The TIP Evaluation Scoring sheet contains a full list of the evaluation criteria and is included in the appendix.
MPO staff obtain the information necessary to conduct evaluations from project Functional Design Reports (FDR). Generally, projects in the early stage of design or the conceptual stage of development are not evaluated.
Staff Recommendation and Draft TIP
The results of the project evaluation process inform project selection. MPO staff uses evaluation ratings and project readiness information to prepare a First-Tier List of Projects. This is a list of the projects with the highest ratings that could be made ready for advertising within the TIP’s time horizon (next four federal fiscal years). The staff relies on the MassDOT Highway Division to provide information about what year a project would be ready for advertising. In developing the staff recommendation for the draft TIP, MPO staff is guided by the First-Tier List of Projects. MPO staff also factors in projects that are listed in the long-range transportation plan in order to implement LRTP commitments, considers geographic equity to help ensure that the list of projects addresses needs throughout the region, and accounts for cost to comply with fiscal constraints.
MPO staff presents the First-Tier List of Projects and staff recommendation of the draft TIP to the MPO for their consideration. The members of the MPO consider the staff recommendation, First-Tier List of Projects, public input, regional importance, and other factors before taking action on the draft TIP.
The MPO votes to approve a draft TIP and release it for a 30-day public review and comment period. During the public review period, MPO staff hosts public meetings to solicit comments from members of the public on the draft TIP. After the comment period ends, the MPO reviews all comments and makes changes to the document as appropriate. It then endorses the TIP and submits it to the federal agencies to enable federal approval at the end of the federal fiscal year, September 30.
Over the last two development cycles, MPO staff have evaluated 48 projects for potential TIP programming. Of the 48 projects evaluated, ratings ranged between a low score of 32 points and a high score of 98 points out of a total of 153 possible points, with an average score of 64.3 points.
The evaluation results are fairly consistent with MPO policies. Projects generally score more points in policy categories with more possible points. Figure 2 shows the comparison between the average points received to the total possible points by policy category. This indicates that projects earn the highest percentage of possible points under System Preservation, Modernization, and Efficiency and the lowest percentage of possible points under Environment and Climate Change. On average, projects received 57% of the 36 possible points under System Preservation, Modernization and Efficiency and 36% of the possible points under Environment and Climate Change.
Figure 2
Results of the TIP Project Evaluations by MPO Policy
Given that a majority of projects improve substandard pavement, improve substandard signal equipment, improve traffic signal operations, and are located in a Congestion Management Process (CMP) area, they tend to score higher under System Preservation, Modernization and Efficiency. Table 1 indicates that for each criterion in this policy category, there was at least one project that received the highest number of possible points. In addition, the first four criteria had the highest average number of points out of all questions across the criteria.
Table 1
System Preservation, Modernization and Efficiency Criteria
Evaluation Criteria |
Total Points Possible |
Highest Points Received |
Average Points Received |
Improves substandard pavement |
6 |
6 |
4.3 |
Improves substandard signal equipment condition |
6 |
6 |
3.4 |
Improves traffic signal operations |
6 |
6 |
4.5 |
In a Congestion Management Process Identified Area |
6 |
6 |
3.9 |
Improves intermodal accommodations/connections to transit |
6 |
6 |
2.9 |
Implements ITS strategies other than traffic signal operations |
6 |
6 |
1.5 |
Total Points |
36 |
36 |
20.5 |
Figure 2 also indicates that projects earn a relatively high percentage of possible points under Environmental Justice (EJ). However, the average is only based on the projects eligible for points under EJ, namely, those that are located within a quarter mile of an EJ area. Given that only five of the 48 projects evaluated were located within a quarter mile of an EJ area, few projects were eligible to earn points under this policy category. These evaluation results suggest that the MPO receives few projects located within EJ areas or that the EJ analysis buffer threshold of a quarter mile used by MPO staff is too limited to capture benefits to surrounding EJ areas.
Staff recommendations:
During the past two development cycles, staff received some comments and concerns about the project evaluation criteria. The most frequent comment raised was that the project evaluation criteria favored projects in dense urban areas. Commenters suggested that projects in dense urban areas are eligible for more points since they are likely to possess existing transit service. They noted that this is unfair: suburban communities without existing transit service have an inherent obstacle to scoring as high in the evaluation process. Commenters suggested that this concern could be addressed by ranking projects based on the percentage of eligible points received.
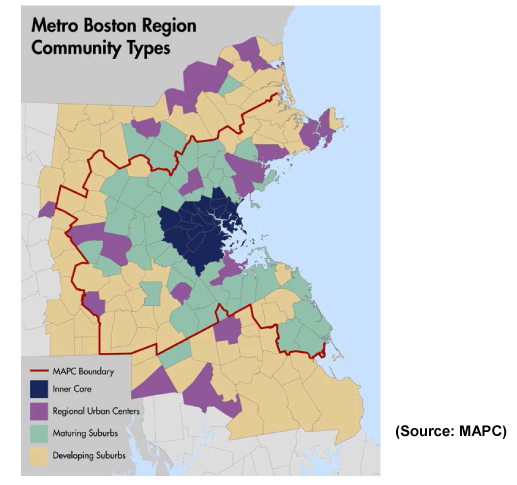
In response to these comments, MPO staff compared project scores across each of MAPC’s four basic community types to determine if projects in dense urban areas scored higher than projects in the rest of the region. The four basic community types, developed during the regional land use plan, MetroFuture: Making a Greater Boston Region, are categorized and identified in Figure 3.
Figure 3
Metro Boston Region Community Types
The community types range from Developing Suburbs that tend to be less developed, with lower densities and a prevalence of single-family housing stock, to Inner Core communities that are primarily built out and typically have higher densities and a prevalence of multi-family housing units. A summary of the four basic community types is included in the appendix.
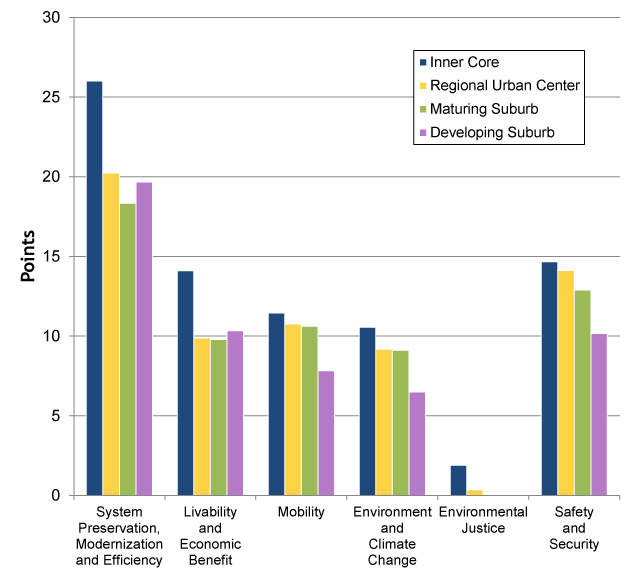
The comparison revealed that projects in the more dense urban Inner Core communities did in fact score higher than projects in less urban areas. The average project rating among Inner Core communities is 78.7 points, while the average project rating for non–Inner Core projects is 61.0 points. The average project rating for all projects is 64.3 points. Figure 4 shows the average project rating by MAPC Community Type across the MPO policy categories. The figure indicates that projects in Inner Core communities score significantly higher than projects in other areas under System Preservation, Modernization, and Efficiency and Livability and Economic Benefit. In addition, projects in Inner Core communities score slightly higher than projects in other areas under Environment and Climate Change, Environmental Justice, and Safety and Security.
Figure 4
Average Project Rating by MAPC Community Type across the MPO Policies
Table 2 lists criteria in which Inner Core communities score noticeably higher than non-Inner Core communities. These results show that projects in Inner Core communities score higher in improving pavement and signal condition, supporting transit access or service, providing safe bicycle and pedestrian access, aligning with MetroFuture compact growth strategies, and serving low-income and minority populations.
Table 2
High Scoring Criteria for Inner Core Communities
Evaluation Criteria
Total Points Possible
Average
Inner Core Points Received
Average
non-Inner Core Points Received
Improves substandard pavement
6
5.1
4.1
Improves substandard signal equipment condition
6
4.7
3.1
Improves intermodal accommodations/connections to transit
6
5.3
2.3
Design is consistent with “complete streets” policies
4
3.2
1.8
Provides multimodal access to an activity center
3
2.7
1.7
Provides for development consistent with the compact growth strategies of MetroFuture
5
4.4
2.7
Improves transit reliability
7
0.6
0.1
Design is consistent with “complete streets” policies in an EJ area
4
0.9
0.1
Addresses an MPO-identified EJ transportation issue
3
0.7
0.1
Total Points
44
27.6
16.0
These results demonstrate that the evaluation criteria favor projects in urban areas, but this prioritization for projects in urban areas is primarily a reflection of the MPO’s visions and policies. The MPO goals of maintaining a state of good repair, increasing transit ridership, reducing automobile dependency, focusing investments on existing activity centers, and providing equitable mobility and access to affordable transportation for low-income and minority persons are more likely to be attained by projects in urban areas.
Although projects in dense urban areas are likely to score higher in the evaluation process, the MPO funds projects in all areas of the region. One of the factors that the MPO considers when selecting projects for funding is geographic equity to ensure that transportation needs are being addressed throughout the region.
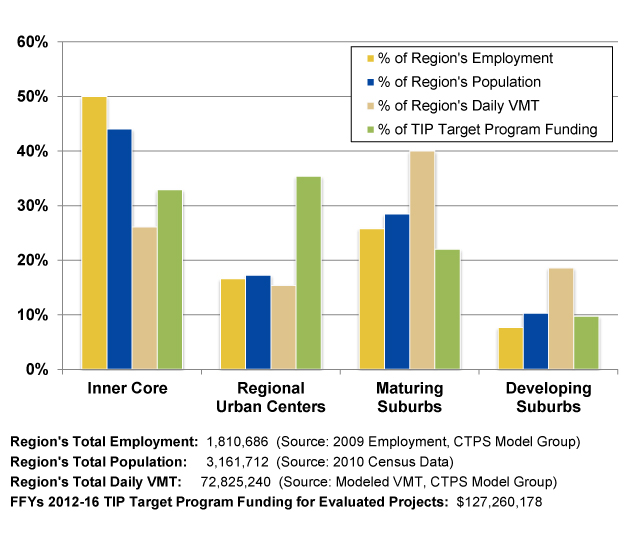
As discussed above, the MPO staff considers project evaluations and ratings first in the development of the First-Tier List. They then look at geographic equity in developing the staff recommendation. During the actual project selection, the MPO considers geographic equity to ensure that progress towards the objectives is balanced across the region. This is evident in recent MPO TIP programming of evaluated projects. Over the last two years, the MPO has programmed approximately $127 million of Target Program funding on evaluated projects. Figure 5 shows how the TIP Target Program funding is allocated across the MAPC Community Types in relation to employment, population, and daily vehicle miles traveled (VMT). These results indicate that funding is programmed across the region, and not concentrated in the Inner Core communities whose projects score higher in the evaluations.
Figure 5
Comparison between Percentage of the Region’s Employment, Population, Daily Vehicle Miles Traveled, and Target Program Funding across Community Types
Staff recommendation:
The MPO policies prioritize transportation investments that are consistent with MetroFuture land use planning. This means supporting investments in already-developed locations of residential or commercial/industrial activity, locations with adequate sewer and water infrastructure, areas identified for economic development by state, regional, and local planning, and areas with a relatively high density of development.
In response to concerns raised by several business organizations that the TIP evaluation criteria did not capture economic development benefits, staff examined the existing criteria in the context of ongoing economic development planning by the Executive Office of Housing and Economic Development (EOHED) and MAPC.
The existing TIP evaluation criteria attempt to determine how each project advances economic development through the following criteria, as shown in Table 3.
Table 3
Economic Development Criteria
Evaluation Criteria |
Total Points Possible |
Highest Points Received |
Average Points Received |
Provides multimodal access to an activity center |
3 |
3 |
1.9 |
Serves a targeted redevelopment site (Chapter 43D priority development sites approved by EOHED; a description of 43D priority development sites is listed in the appendix ) |
6 |
2 |
0.1 |
Provides for development consistent with the compact growth strategies of MetroFuture |
5 |
5 |
3.0 |
Improves or completes an MPO- or State-identified freight movement issue |
3 |
2 |
0.4 |
Total Points |
17 |
12 |
5.4 |
The existing TIP evaluation criteria offer 17 possible points to measure the economic development benefits of a project; however the average project receives only 5.4 of the 17 points. Only two projects received points for serving a Chapter 43D priority development site (the Chapter 43D program that offers communities expedited permitting for approved sites that promote targeted economic and housing development). In addition, only 11 of the 48 projects received points for improving an MPO- or State-identified freight movement issue.
These results suggest that the existing criteria do not take into account all the various planning efforts to target development areas. In addition to Chapter 43D priority development sites, there are numerous other tools to support future growth and development. The following programs offer additional tools and resources to advance growth in the region.
EOHED Planning Ahead for Growth:
The Planning Ahead for Growth initiative strives to identify, create, invest, and market opportunities to support job and housing growth across the Commonwealth in partnership with local communities. Planning Ahead for Growth uses various tools to advance these objectives, including:
Compact Neighborhoods Policy:
The Department of Housing and Community Development’s new policy initiative offers incentives to municipalities to create zoning districts of a kind that promote the Commonwealth’s strong interest in housing for working families of all incomes and in smart growth. These zoning districts or “Compact Neighborhoods” will be required to meet density thresholds of at least eight units per acre for Developable Land zoned for multi-family residential use (two-family or more) or at least four units per acre for Developable Land zoned for single-family residential use. This new tool complements Chapter 40R, the Commonwealth’s Smart Growth Overlay District statute.
MAPC’s Subregional Priority Development Planning (Mapping) Projects:
The subregional priority mapping projects will help establish land use goals and strategies for the region by creating community-based priorities, integrating municipal priorities into regional and state development and preservation strategies, and guiding public investments toward the priorities of each subregion. The mapping project will identify priority development areas (PDAs) and priority preservation areas (PPAs) to guide and inform future land use decisions. This process will also help municipalities to identify housing opportunities, provide for sustainable growth patterns, identify opportunities to maximize transportation choices and promote healthy environments.
Expanding the evaluation criteria to reward projects that advance these strategic planning initiatives would help to strengthen the link between housing and economic development planning and MPO transportation investments.
In addition to these strategic planning initiatives, MAPC has developed more land use and economic development data associated with MetroFuture compact growth strategies. MAPC has established concentrated development area thresholds (based on the combined 2010 population and 2011 employment per acre) for each community type. The thresholds range from 3.5 persons per acre in Developing Suburbs to 16.6 persons per acre in the Inner Core. Incorporating these thresholds into the existing criteria would bring in quantitative data to support the evaluation process.
Staff recommendations:
The MPO policies prioritize transportation investments across and between modes. The MPO seeks to increase mode share for transit and nonmotorized modes by closing gaps in the bicycle and pedestrian network and improving access to transit for all persons. In addition, the MPO has a new mandate – to support MassDOT’s new mode shift goal to triple the share of travel by walking, bicycling, and transit by 2030.
In response to concerns raised by members of the public that the evaluation criteria do not adequately differentiate among shared-use path projects, staff examined the variation in evaluation ratings for shared-use path projects.
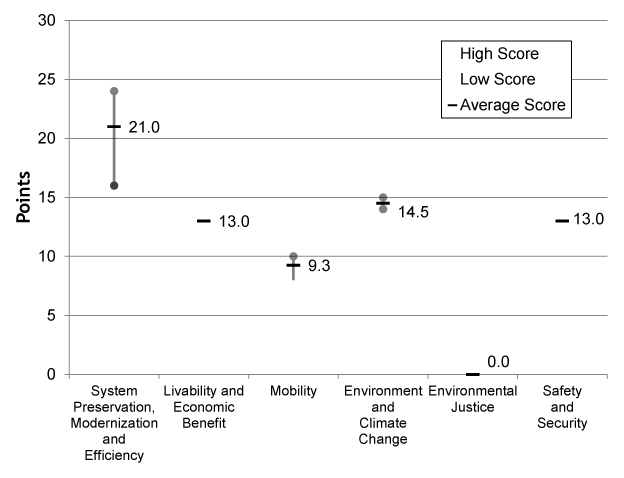
While shared-use path projects score higher than the average project, there is little variation among shared-use path project scores. MPO staff evaluated four shared-use path projects; the ratings ranged from a low score of 67 points to a high score of 74 points, with an average score of 70.8 points. Figure 6 shows the variation between the low score, high score, and average project rating for shared-use path projects across the MPO policies. This figure indicates that there is little variation among high and low scores for shared-use path projects under Livability and Economic Benefit, Mobility, Environment and Climate Change, and Safety and Securit
Figure 6
Variation among Low Scores, High Scores, and Average Project Ratings for Shared-use Path Projects
This lack of variation among shared-use path projects is somewhat explained by the limited effectiveness of the criteria in reflecting the benefits of nonmotorized improvements. Nonmotorized improvements, including shared-use path projects, often the quantified and routinely collected data measurements commonly available for analyzing transit service or roadway improvement projects. Limitations in safety, connectivity, and usage data present challenges to evaluating and prioritizing projects such as shared-use paths.
Despite the limited usefulness of the evaluation criteria in comparing shared-use path projects, MPO staff is working to bring forward additional information on shared-use path projects for MPO members. Since last year’s evaluations, MPO staff has worked on inventorying greenhouse gas (GHG) emissions for projects under consideration, including shared-use paths, to identify those that are most effective in reducing carbon dioxide (CO2). MPO staff hopes that this information will help better distinguish among shared-use path projects based on each project’s effectiveness at reducing carbon dioxide through anticipated reductions in vehicle miles traveled. In addition, MPO staff is currently conducting a Bicycle Network Evaluation Study that will prioritize gaps in the system based on safety, connectivity, and usage factors. The results from this study can help inform the project selection of shared-use path projects in the future.
Since the development of the TIP evaluation criteria, MassDOT has established the Bay State Greenway (BSG) Priority 100 that comprises key shared-use path projects that will increase the existing BSG by approximately 100 miles. The focus of the BSG 100 is on making additional connections to urban centers, extending existing paths, and maximizing the transportation utility of the network. The table below summarizes the projects in the BSG 100.
Table 4
Bay State Greenway Priority 100 Projects in the Boston Region
Project Name (Municipalities Involved) |
Miles |
Mass Central Rail Trail or “Wayside Trail” (Berlin, Hudson, Sudbury, Waltham, Wayland, Weston) |
24.4 |
Bruce Freeman Rail Trail Extension (Acton, Carlisle, Concord, Westford) |
8.4 |
Reformatory Branch Trail (Bedford) |
2.3 |
Neponset River Greenway Phase 2 (Boston, Milton) |
4.6 |
Border to Boston, South Section (Danvers, Topsfield, Wenham) |
9.1* |
Northern Strand Community Trail or “Bike to the Sea” (Everett, Lynn, Malden, Revere, Saugus) |
9.0** |
Community Path Extension (Somerville) |
2.0 |
Total Miles |
63.9 |
*An unimproved surface has been completed for the entire length.
**An unimproved surface has been completed for part of the length.Modifying the evaluation criteria to reward shared-use path projects that are BSG priorities would provide a basis for differentiating among shared-use path projects.
Staff recommendations:
Under MAP-21, states are required to develop performance goals, guided by the national goals set out in MAP-21, and MPOs are required to work with state DOTs in developing MPO performance targets. The TIP will integrate the MPO’s performance measures and link transportation investment decisions to progress toward the achievement of performance goals. The MPO will be required to evaluate and report on the condition and performance of the transportation system. The TIP must include a description of the anticipated effect of the TIP projects on progress toward achieving the performance targets.
In regard to safety, the TIP criteria will have to integrate Highway Safety Improvement Program (HSIP) performance measures to achieve a significant reduction in traffic fatalities and serious injuries on all public roads. To support the national goal of infrastructure condition, the TIP criteria will have to integrate Interstate and National Highway System (NHS) performance measures to achieve standards for pavement condition and bridge condition. In regard to freight movement and economic vitality, the TIP criteria will have to integrate performance measures that support the region’s freight movements and centers of economic activity.
MAPC established the community types during the development of its regional land use plan, MetroFuture: Making a Greater Boston Region in order to understand how regional trends will affect the region’s diverse communities over the coming decades. MAPC Community Types are defined by land use and housing patterns, recent growth trends, and projected development patterns. The four basic community types are summarized below.
Targeted Development Areas include 43D Priority Development Sites, 43E Priority Development Sites, 40R Smart Growth Zoning Overlay Districts, Regionally Significant Priority Development Areas, Growth District Initiatives, and Eligible MBTA Transit Station Areas located within ½ mile of the project area. The six eligible targeted development areas are summarized below.
KQ/SP/sp