TIP Project Impacts Before-After Evaluation
Project Manager
Mark S. Abbott
Author
Andrew Nagle
3 Information Sources for the Selected Projects
4 Pleasant Street (Route 60)—Belmont
4.1 Summary of Conditions Before and After Improvements
4.2 Comparisons of Crash Data, Traffic Volumes, and Traffic Analyses
5 Turnpike Street (Route 138), Two Locations—Canton
5.1 Summary of Conditions Before and After Improvements
5.2 Comparisons of Crash Data, Traffic Volumes, and Traffic Analyses
6 King Street at Interstate 495 (Union Street/Upper Union Street/Constitution Boulevard)—Franklin
6.1 Summary of Conditions Before and After Improvements
6.2 Comparisons of Crash Data, Traffic Volumes, and Traffic Analyses
7 Washington Street (Route 53) at Old Washington Street Safety Improvement Project—Hanover
7.1 Summary of Conditions Before and After Improvements
7.2 Comparisons of Crash Data, Traffic Volumes, and Traffic Analyses
This study evaluated the effectiveness of proposed safety and operational improvements for selected Transportation Improvement Program (TIP) projects. It is important to assess whether strategies employed in these projects would be successful and suitable in similar situations. In addition, federal regulation requires before-and-after evaluations as part of the mandatory Congestion Management Process (CMP). In 2012, MPO staff completed another study that compared before-and-after conditions at two TIP projects in Arlington and Westwood.
In this report, MPO staff selected four new TIP projects that were constructed in federal fiscal years 2009 and 2010 to evaluate the effectiveness of several mitigation measures to improve intersection safety and operations. Before-and-after data, such as traffic volumes and crashes, were collected to analyze 11 intersections in four different communities. The years 2009 and 2010 were selected for project completion to allow roadway users to become familiar with the updated operations, and for travel demand to normalize in the area. MPO staff gathered the before data and effectiveness measures from existing functional design reports (FDRs) and traffic studies; it then collected recent traffic counts and crash data to analyze the after conditions and compare them to the before conditions reported in the FDR.
This memorandum summarizes the before-and-after effects of safety and operations at 11 intersection locations from four TIP projects funded by the Boston Region MPO. Project locations were Belmont—FDR “Pleasant Street, Belmont MA,” Canton—FDR “Route 138 – Two Locations, Canton MA,” Franklin—FDR “King Street at Interstate 495 (Union Street/Upper Union Street/Constitution Boulevard), Town of Franklin, MA,” and Hanover—FDR “Washington Street (Route 53) at Old Washington Street Safety Improvement Project, Hanover, MA.”
The 11 intersections studied in this report are:
The projects cited above were selected from the Massachusetts Department of Transportation (MassDOT) Project Information website.1
Staff used the following steps to select the projects:
Staff used the following measures of effectiveness (MOEs) to evaluate each project:
For the three intersections in Belmont, staff extracted data from the FDR “Pleasant Street, Belmont MA,” completed in December 1999 by The BSC Group, Inc.
The Belmont project involved reconstructing more than 1.8 miles of roadway; new sidewalks, guardrail, drainage systems, fieldstone walls; three signalized intersections; and installing traffic signs and pavement markings. Construction began in winter 2004 and finished in summer 2008. The estimated cost was $7,674,231, and the actual construction contract cost was $8,568,684.
For the two intersections in Canton, staff extracted data from the FDR “Route 138 – Two Locations, Canton MA,” completed in October 2001 by Vanasse Hangen Brustlin, Inc.
The Canton project involved roadway improvements—associated in part with the construction of Reebok World Headquarters—that consisted of roadway widening, new sidewalks, bicycle accommodations, traffic signal modifications, and improved pavement markings and drainage. Construction began in winter 2005 and finished in spring 2009. The estimated cost was $1,623,183, and the actual construction contract cost was $2,990,582.
For the five intersections in Franklin, staff extracted data from the FDR “King Street at Interstate 495 (Union Street/Upper Union Street/Constitution Boulevard), Town of Franklin, MA,” completed in September 2001 by Bruce Campbell and Associates, Inc.
The Franklin project focused on safety and traffic improvements, extending along King Street from Union Street to Upper Union Street, including Upper Union Street from King Street to Constitution Boulevard, and all four I-495 ramps. The project primarily involved widening King Street to provide two lanes in each direction and realigning Upper Union Street to make Constitution Boulevard the major traffic movement. The construction included new traffic signals and coordinating the King Street traffic signals, drainage improvements, new sidewalks, pavement markings, signing, and landscaping. Construction began in summer 2009 and finished in summer 2010. The estimated cost was $4,453,800, and the actual construction contract cost was $3,420,413.
For the one intersection in Hanover, staff extracted data from the FDR “Washington Street (Route 53) at Old Washington Street Safety Improvement Project, Hanover, MA,” completed in August 2005 by Vanasse Hangen Brustlin, Inc. This FDR was included as part of phase 1B in a larger reconstruction project along Route 53 in Hanover.
The Hanover project involved widening Route 53 to a five-lane cross section and upgrading the traffic signal system at the Old Washington Street intersection. In addition, Pond Street was relocated to align with Old Washington Street. Reconstruction also included new curbs, sidewalks, and pavement markings. Construction began in winter 2007 and finished in autumn 2010. The estimated cost was $5,336,698, and the actual construction cost was $6,233,125.
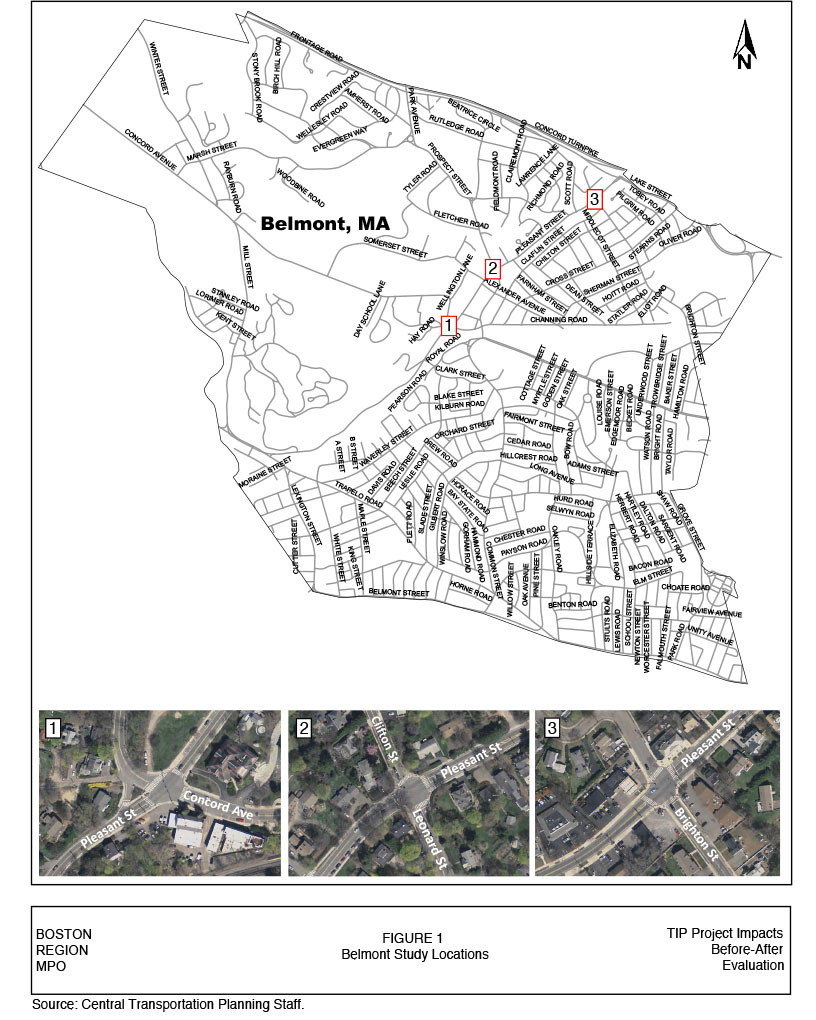
Pleasant Street (Route 60) is an east-west roadway that is classified as an urban principal arterial. Pleasant Street begins to the west near the Waltham city line at Trapelo Road, traverses through the Town of Belmont, and ends beyond Route 2 to the east at the Arlington town line. Mixtures of residential, commercial, governmental, and institutional uses exist along Pleasant Street, including the Belmont Police Station and Belmont Town Hall, which are adjacent to the intersection of Pleasant Street at Concord Avenue. The Belmont study locations are illustrated in Figure 1.
The following sections provide a summary of the before-and-after conditions, along with a comparison of the crash data, traffic volumes, and traffic analysis at three signalized intersections along the Pleasant Street corridor.
The intersection of Pleasant Street at Concord Avenue was a four-legged signalized intersection with post-mounted signal heads at Belmont Center. A steep downgrade existed on the southbound Concord Avenue approach. Crosswalks were provided on the westbound Pleasant Street and northbound Concord Avenue approaches with pushbutton-actuated pedestrian signals. Sidewalks were provided on both sides of the westbound and northbound approaches and the south side of the eastbound approach. No bicycle accommodations were provided. The eastbound and westbound Pleasant Street approaches had a single travel lane. Approximately 100 feet west of the intersection, dedicated lanes were provided for westbound left turns from Pleasant Street onto Concord Avenue and for southbound right turns from Concord Avenue onto Pleasant Street, as shown in Figure 2.
The crash rate before reconstruction of the intersection was 0.60 crashes per million entering vehicles. According to the FDR, eight of the 14 crashes were rear-end collisions, and five were angle collisions. Six people were injured in these crashes.
The intersection operated at an overall LOS C in the AM peak hour and LOS B during the PM peak hour, with an average delay of 25.2 seconds per vehicle (sec/veh) and 17.9 sec/veh, respectively.
FIGURE 1
Belmont Study Locations
FIGURE 2
Before-and-After Reconstruction of Pleasant Street at Concord Avenue
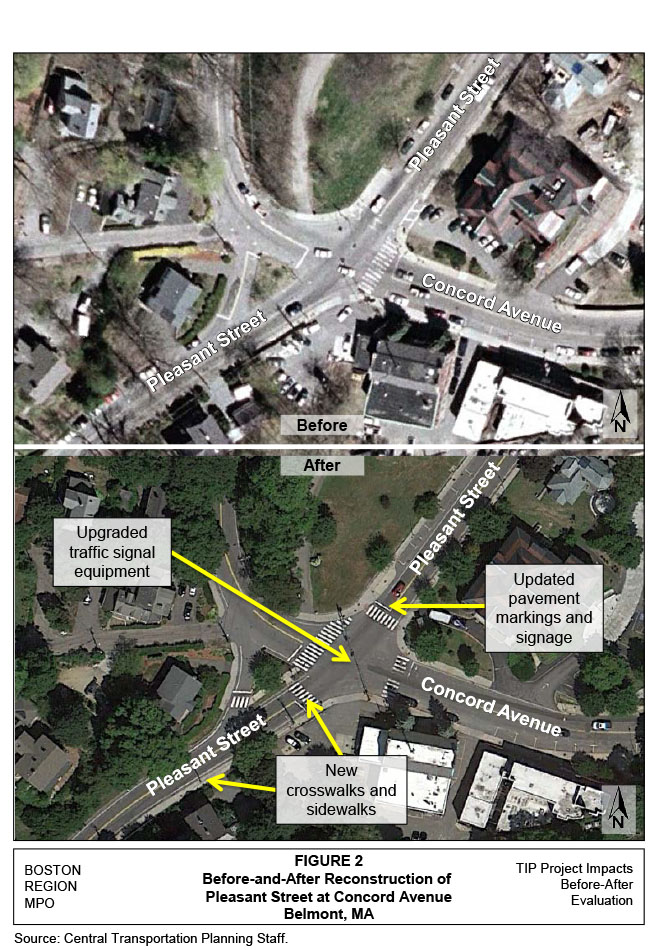
The intersection was reconstructed to improve traffic operations and safety, full depth pavement reconstruction and replacement of existing traffic control equipment. Pleasant Street was constructed with a uniform pavement cross section of 28 feet (36 feet where parking is permitted).
Improvements to this intersection included installation of a modern fully actuated traffic signal controller, with two new traffic signal mast arms located in the northeast and southwest corners of the intersection. Sidewalks now are provided on both sides of all approaches except the east side of the southbound approach and north side of the eastbound approach. A shared shoulder for bicycle travel is located on all directions of travel along Pleasant Street and Concord Avenue; and bicycle detection is provided on all approaches. Traffic signal phasing was updated to include an advanced left-turn phase for the northbound Concord Avenue approach with an overhead mounted five-section signal head to improve traffic operations for the northbound approach. In addition, pavement markings and signage were updated on all approaches, which included providing crosswalks on all intersection approaches with pedestrian signal heads and a pushbutton-activated exclusive pedestrian phase.
The crash rate for the years 2008 to 2012 is 0.44 crashes per million entering vehicles, which is considerably lower than the current MassDOT District 4 average rate of 0.77 crashes per million entering vehicles for signalized intersections. Analysis of current existing conditions shows that the intersection operates at an LOS C in the AM peak period and an LOS D in the PM peak period, with delays of 30.8 sec/veh and 45.2 sec/veh, respectively.
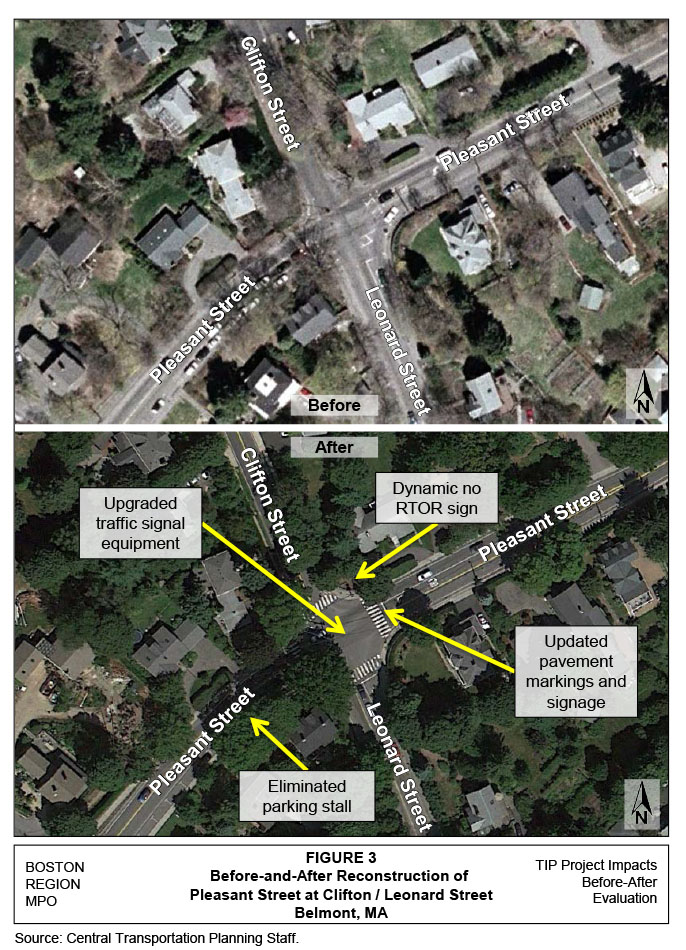
The intersection of Pleasant Street at Clifton/Leonard Street was a fully actuated four-legged signalized intersection. Crosswalks were provided on all approaches, and the pedestrian signals were pushbutton actuated. Sidewalks, but no bicycle accommodations, were provided on both sides of all approaches at this intersection. The eastbound Pleasant Street approach had a single travel lane, and the westbound Pleasant Street approach had an exclusive left-turn lane and a shared through-right lane, as shown in Figure 3. Clifton Street runs to the north and intersects with Prospect Street; Leonard Street runs to the south through Belmont Center. The southbound Clifton Street approach had a single lane that accommodated all traffic movements, and the northbound Leonard Street had an exclusive right-turn lane and a shared left-through lane. Parking was permitted on the south side of the eastbound Pleasant Street approach.
FIGURE 3
Before-and-After Reconstruction of Pleasant Street at Clifton/Leonard Street
The crash rate before reconstruction of the Pleasant Street at Clifton/Leonard Street intersection was 0.75 crashes per million entering vehicles. According to the FDR, nine of the 20 crashes were angle collisions, and six of the 20 crashes were rear-end collisions. Four personal injuries were reported at this intersection during the 1994-1996 analysis period.
The intersection operated at an overall LOS E in the AM peak hour and LOS D in PM peak hour, primarily because of considerable delays and long queues on the eastbound Pleasant Street approach. Thus, it was necessary to reconstruct the intersection to improve overall traffic operations.
Widening Pleasant Street at this intersection was infeasible because of right-of-way restrictions. The majority of improvements at this intersection were traffic signal operations related, such as modifying traffic signal timings and eliminating a parking stall nearest to the intersection on the eastbound approach.
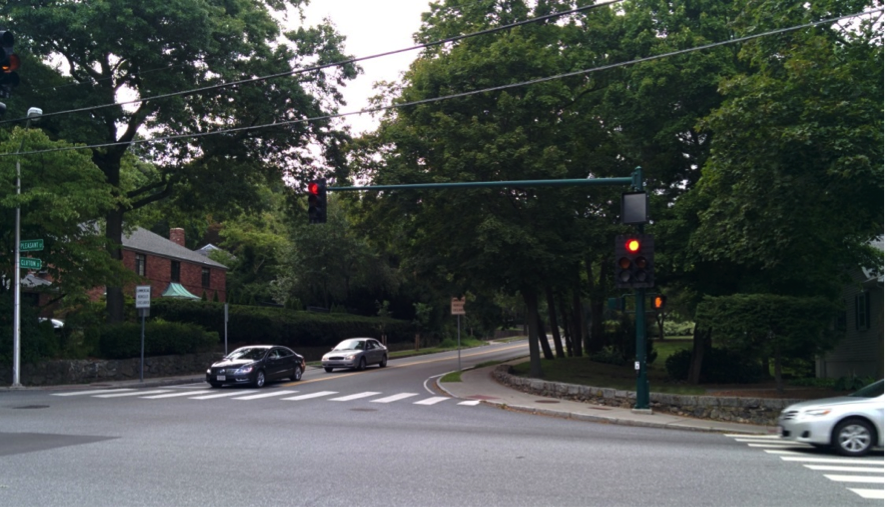
A modern, fully actuated traffic signal controller was installed at this intersection, and the signal phasing was modified to allow a leading advanced westbound left-turn phase on Pleasant Street with a concurrent overlapping right turn from Leonard Street onto Pleasant Street. This phasing change was made to improve traffic operations for the westbound left-turn movement. In order to improve right turn on red (RTOR) safety and operations, a dynamic no RTOR sign was installed in the northeast corner of the intersection for northbound right-turn movements, as shown in Figure 4. Two new signal mast arms were installed at the northeast and northwest corners of the intersection. A shared shoulder for bicycle travel was provided for all directions of travel along Pleasant Street and Leonard/Clifton Street. Bicycle detection was provided on all approaches; and construction included improved pavement markings and signage on all approaches.
FIGURE 4
Dynamic No-RTOR Sign at Leonard/Clifton Street
For 2008 to 2012, the crash rate was 0.40 crashes per million entering vehicles. This rate is lower than the crash rate before the improvements were made and is below the current MassDOT District 4 average rate of 0.77 at signalized intersections. The analysis of current existing conditions shows an improvement of traffic operations to LOS C in the AM and PM peak hours, with delays of 27.4 sec/veh and 30.9 sec/veh, respectively. Therefore, the optimized traffic signal timings and phasing improved the intersection operations to LOS C, significantly reducing vehicular delays and queues.
The intersection of Pleasant Street at Brighton Street was a fully actuated four-legged signalized intersection. Crosswalks were provided on all approaches, and pedestrian signals were pushbutton actuated. Sidewalks were provided on both sides of all approaches to the intersection; however, bicycle accommodations were not provided. The eastbound Pleasant Street approach had a single travel lane for all movements, and the westbound Pleasant Street approach had an exclusive left-turn lane and a shared through-right lane, as shown in Figure 5. Brighton Street runs north south and is approximately 1/10 of a mile west of Route 2. Both the northbound and southbound Brighton Street approaches provide a single lane to accommodate all traffic movements; however, although the northbound approach is striped as a single lane, it operates as two lanes.
FIGURE 5
Before-and-After Reconstruction of Pleasant Street at Brighton Street
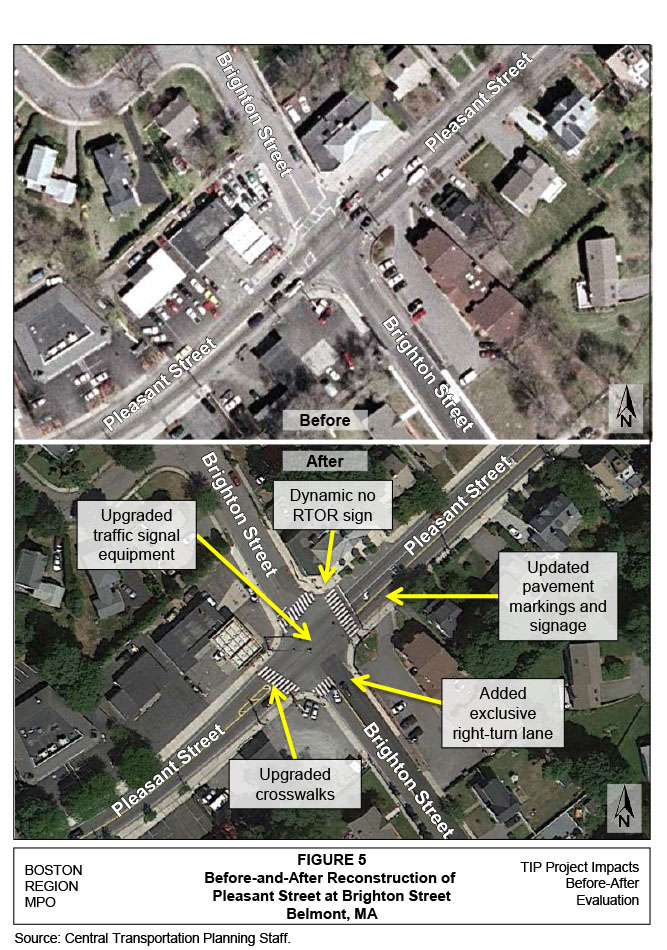
The crash rate before reconstructing the intersection was 0.94 crashes per million entering vehicles. According to the FDR, 17 of the 27 crashes were angle collisions, and eight were rear-end collisions. Five personal-injury crashes were reported at this intersection during the three-year analysis period.
The intersection operated at an overall LOS C in the AM peak hour and LOS B in the PM peak hour, with the eastbound Pleasant Street approach incurring the highest delays. Thus, it was necessary to reconstruct the intersection to improve overall safety operations.
The reconstruction of the Pleasant Street at Brighton Street intersection included adding an exclusive right-turn lane on the northbound Brighton Street approach. Although the before conditions operated with this configuration, providing signage and striping to meet necessary Manual on Uniform Traffic Control Devices (MUTDC) standards improved traffic operations and safety.
A modern, fully actuated traffic signal controller also was installed at this intersection, and the signal phasing was modified to allow an advanced westbound left-turn phase on Pleasant Street with a concurrent overlapping right-turn phase from Brighton Street onto Pleasant Street. This phasing change was made to improve traffic operations for northbound right-turn movements and westbound left-turn movements. A dynamic RTOR sign was installed on the northeast corner of the intersection to improve safety of northbound right-turn operations, as illustrated in Figure 6. A shared shoulder for bicycle travel was provided on all approaches of Pleasant Street and Brighton Street, including bicycle detection. Two new overhead mast arms at the northwest and southeast corners of the intersection, upgraded pedestrian traffic signals, and improved signage and pavement markings were installed.
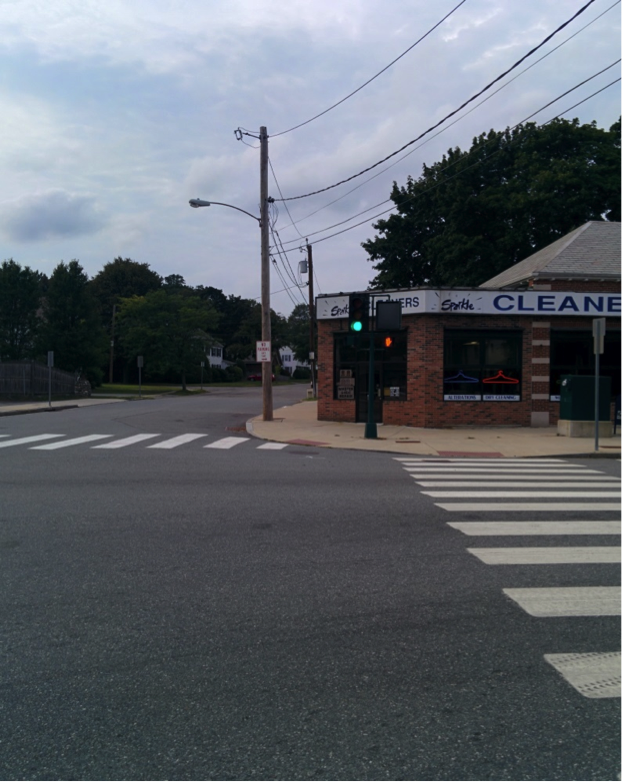
FIGURE 6
Dynamic No-RTOR Sign at Brighton Street
The crash rate for 2008 to 2012 is 0.39 crashes per million entering vehicles, which is nearly one-third lower than before the improvements were made, and is below the current MassDOT District 4 average rate of 0.77 at signalized intersections. Analysis of current existing conditions shows improvement of traffic operations to LOS B in the AM and PM peak hours, with delays of 17.8 sec/veh and 15.5 sec/veh, respectively. Therefore, the optimized traffic signal timings and phasing improved the intersection operations significantly by reducing vehicular delays and queues.
Crash data from the Belmont FDR were compared to current MassDOT Registry of Motor Vehicles Division (RMV) data from 2008 to 2012, which is the most recent five-year period available. Tables 1-3 summarize the crashes by year for the three study intersections. The total and average number of crashes in the five-year after period only includes crashes that occurred after construction was complete, in the summer of 2008. Appendix C includes collision diagrams for the three intersections.
Fourteen crashes occurred at the intersection of Pleasant Street at Concord Avenue during the three-year before period, averaging 4.7 crashes per year. During the after period between 2008 and 2012, there were 16 crashes with an average of 3.5 crashes per year. In addition, the crash rate is an effective tool for examining the relative safety at a particular location. Crash rates are estimated based on crash frequency and vehicle exposure (traffic volumes or miles traveled). The crash rate for the before period was 0.60 crashes per million entering vehicles, and 0.44 in the after period. The District 4 average for signalized intersections is 0.77 crashes per million entering vehicles. Crash rate calculation forms are included in Appendix B.
Twenty crashes occurred at the intersection of Pleasant Street at Clifton/Leonard Street between 1994 and 1996, as reported in the FDR. An average of 6.7 crashes occurred per year during this period. Between 2008 and 2012 (the most recent data period), there were 16 crashes, averaging 3.5 crashes per year. The average number of angle crashes decreased from 5.7 crashes per year to 1.3 crashes per year. The crash rate in the before conditions was 0.75 crashes per million entering vehicles, decreasing to 0.40 crashes per million vehicles in the after conditions. The crash rate for the most recent data available is less than the District 4 average for signalized intersections.
At the intersection of Pleasant Street at Brighton Street, there were 27 reported crashes between 1994 and 1996, as reported in the FDR, with an average of nine crashes per year. Between 2008 and 2012 (the most recent data period), there were 14 crashes, averaging 3.1 crashes per year. The average number of angle crashes decreased from 5.7 crashes per year to 0.9 crashes per year. The crash rate in the before conditions was 0.94 crashes per million entering vehicles, decreasing to 0.39 crashes per million vehicles in the after conditions. The crash rate for the most recent data available is less than the District 4 average crash rate for signalized intersections.
Crash Category |
1994 |
1995 |
1996 |
Total |
Average |
20082 |
2009 |
2010 |
2011 |
2012 |
Total |
Average3 |
|---|---|---|---|---|---|---|---|---|---|---|---|---|
Crash severity |
N/A |
N/A |
N/A |
N/A |
N/A |
N/A |
N/A |
N/A |
N/A |
N/A |
N/A |
N/A |
Property damage only |
0 |
6 |
3 |
9 |
3 |
1 |
1 |
2 |
1 |
3 |
8 |
1.8 |
Personal injury |
4 |
0 |
1 |
5 |
1.7 |
0 |
1 |
0 |
0 |
1 |
2 |
0.4 |
Fatality |
0 |
0 |
0 |
0 |
0 |
0 |
0 |
0 |
0 |
0 |
0 |
0 |
Collision type |
N/A |
N/A |
N/A |
N/A |
N/A |
N/A |
N/A |
N/A |
N/A |
N/A |
N/A |
N/A |
Not reported |
0 |
0 |
0 |
0 |
0 |
0 |
0 |
0 |
0 |
0 |
0 |
0 |
Angle |
2 |
3 |
0 |
5 |
1.7 |
0 |
1 |
1 |
0 |
0 |
2 |
0.4 |
Rear-end |
1 |
3 |
4 |
8 |
2.7 |
1 |
0 |
0 |
4 |
2 |
7 |
1.5 |
Side-swipe |
— |
— |
— |
— |
— |
0 |
1 |
1 |
0 |
0 |
2 |
0.4 |
Head-on |
1 |
0 |
0 |
1 |
0.3 |
0 |
0 |
0 |
0 |
2 |
2 |
0.4 |
Single-vehicle |
— |
— |
— |
— |
— |
0 |
0 |
3 |
0 |
0 |
3 |
0.7 |
Roadway conditions |
N/A |
N/A |
N/A |
N/A |
N/A |
N/A |
N/A |
N/A |
N/A |
N/A |
N/A |
N/A |
Not reported |
0 |
0 |
0 |
0 |
0 |
0 |
0 |
0 |
0 |
1 |
1 |
0.2 |
Wet or icy pavement |
2 |
1 |
2 |
5 |
1.7 |
0 |
0 |
3 |
1 |
2 |
6 |
1.3 |
Weather conditions |
N/A |
N/A |
N/A |
N/A |
N/A |
N/A |
N/A |
N/A |
N/A |
N/A |
N/A |
N/A |
Dark/lighted |
2 |
0 |
2 |
4 |
1.3 |
0 |
0 |
3 |
1 |
0 |
4 |
0.9 |
Clear |
— |
— |
— |
— |
— |
0 |
1 |
3 |
2 |
1 |
7 |
1.5 |
Cloudy |
— |
— |
— |
— |
— |
0 |
1 |
0 |
0 |
1 |
2 |
0.4 |
Rain |
— |
— |
— |
— |
— |
1 |
0 |
1 |
0 |
2 |
4 |
0.9 |
Snow |
— |
— |
— |
— |
— |
0 |
0 |
1 |
1 |
0 |
2 |
0.4 |
Crashes during weekday peak periods1 |
2 |
2 |
1 |
5 |
1.7 |
0 |
1 |
0 |
3 |
1 |
5 |
1.1 |
Crashes involving pedestrian(s) |
— |
— |
— |
— |
— |
0 |
0 |
0 |
0 |
0 |
0 |
0 |
Crashes involving bicyclist(s) |
— |
— |
— |
— |
— |
0 |
0 |
0 |
0 |
0 |
0 |
0 |
Total crashes |
4 |
6 |
4 |
14 |
4.7 |
1 |
2 |
5 |
4 |
4 |
16 |
3.5 |
1 Peak periods are defined as 7:00–10:00 AM and 3:30–6:30 PM. 2 The number of crashes in 2008 only includes crashes that occurred after construction was complete in summer 2008. 3 The average number of crashes in the after period is averaged across 4.58 years.
Source: Central Transportation Planning Staff.
Crash Category |
1994 |
1995 |
1996 |
Total |
Average |
20082 |
2009 |
2010 |
2011 |
2012 |
Total |
Average3 |
|---|---|---|---|---|---|---|---|---|---|---|---|---|
Crash severity |
N/A |
N/A |
N/A |
N/A |
N/A |
N/A |
N/A |
N/A |
N/A |
N/A |
N/A |
N/A |
Property damage only |
1 |
6 |
9 |
16 |
5.3 |
3 |
2 |
1 |
4 |
1 |
11 |
2.4 |
Personal injury |
1 |
2 |
1 |
4 |
1.3 |
1 |
0 |
1 |
1 |
0 |
3 |
0.7 |
Fatality |
0 |
0 |
0 |
0 |
0 |
0 |
0 |
0 |
0 |
0 |
0 |
0 |
Collision type |
N/A |
N/A |
N/A |
N/A |
N/A |
N/A |
N/A |
N/A |
N/A |
N/A |
N/A |
N/A |
Not reported |
1 |
1 |
2 |
4 |
1.3 |
0 |
0 |
0 |
0 |
0 |
0 |
0 |
Angle |
0 |
5 |
4 |
9 |
3.0 |
1 |
1 |
1 |
3 |
0 |
6 |
1.3 |
Rear-end |
1 |
2 |
3 |
6 |
2.0 |
2 |
2 |
0 |
2 |
0 |
6 |
1.3 |
Side-swipe |
— |
— |
— |
— |
— |
0 |
0 |
1 |
1 |
1 |
3 |
0.7 |
Head-on |
0 |
0 |
1 |
1 |
0.3 |
1 |
0 |
0 |
0 |
0 |
1 |
0.2 |
Single-vehicle |
— |
— |
— |
— |
— |
0 |
0 |
0 |
0 |
0 |
0 |
0 |
Roadway conditions |
N/A |
N/A |
N/A |
N/A |
N/A |
N/A |
N/A |
N/A |
N/A |
N/A |
N/A |
N/A |
Not reported |
0 |
0 |
0 |
0 |
0 |
0 |
0 |
0 |
0 |
1 |
1 |
0.2 |
Wet or icy pavement |
1 |
5 |
4 |
10 |
3.3 |
1 |
2 |
0 |
1 |
0 |
4 |
0.9 |
Weather conditions |
N/A |
N/A |
N/A |
N/A |
N/A |
N/A |
N/A |
N/A |
N/A |
N/A |
N/A |
N/A |
Dark/lighted |
1 |
1 |
2 |
4 |
1.3 |
0 |
1 |
2 |
1 |
1 |
5 |
1.1 |
Clear |
— |
— |
— |
— |
— |
3 |
2 |
1 |
4 |
0 |
10 |
2.2 |
Cloudy |
— |
— |
— |
— |
— |
0 |
0 |
1 |
2 |
0 |
3 |
0.7 |
Rain |
— |
— |
— |
— |
— |
0 |
1 |
0 |
0 |
0 |
1 |
0.2 |
Snow |
— |
— |
— |
— |
— |
1 |
0 |
0 |
0 |
0 |
1 |
0.2 |
Crashes during weekday peak periods1 |
2 |
4 |
5 |
11 |
3.7 |
0 |
0 |
0 |
0 |
0 |
0 |
0 |
Crashes involving pedestrian(s) |
— |
— |
— |
— |
— |
0 |
0 |
0 |
0 |
0 |
0 |
0 |
Crashes involving bicyclist(s) |
— |
— |
— |
— |
— |
0 |
0 |
0 |
1 |
0 |
1 |
0.2 |
Total crashes |
2 |
8 |
10 |
20 |
6.7 |
4 |
3 |
2 |
6 |
1 |
16 |
3.5 |
1 Peak periods are defined as 7:00–10:00 AM and 3:30–6:30 PM. 2 The number of crashes in 2008 only includes crashes that occurred after construction was complete in summer 2008. 3 The average number of crashes in the after period is averaged across 4.58 years.
Source: Central Transportation Planning Staff.
Crash Category |
1994 |
1995 |
1996 |
Total |
Average |
20082 |
2009 |
2010 |
2011 |
2012 |
Total |
Average3 |
|---|---|---|---|---|---|---|---|---|---|---|---|---|
Crash severity |
|
|
|
|
|
Blank |
Blank |
Blank |
|
|
Blank |
Blank |
Property damage only |
8 |
9 |
6 |
23 |
7.7 |
5 |
1 |
1 |
4 |
0 |
11 |
2.4 |
Personal injury |
2 |
1 |
1 |
4 |
1.3 |
0 |
1 |
0 |
2 |
0 |
3 |
0.7 |
Fatality |
0 |
0 |
0 |
0 |
0 |
0 |
0 |
0 |
0 |
0 |
0 |
0 |
Collision type |
|
|
|
|
|
|
|
|
|
|
|
|
Not reported |
1 |
1 |
0 |
2 |
0.7 |
0 |
1 |
0 |
0 |
0 |
1 |
0.2 |
Angle |
6 |
6 |
5 |
17 |
5.7 |
1 |
0 |
0 |
3 |
0 |
4 |
0.9 |
Rear-end |
3 |
3 |
2 |
8 |
2.7 |
2 |
0 |
1 |
2 |
0 |
5 |
1.1 |
Side-swipe |
— |
— |
— |
— |
— |
2 |
0 |
0 |
1 |
0 |
3 |
0.7 |
Head-on |
0 |
0 |
0 |
0 |
0 |
0 |
0 |
0 |
0 |
0 |
0 |
0 |
Single-vehicle |
— |
— |
— |
— |
— |
0 |
1 |
0 |
0 |
0 |
1 |
0.2 |
Roadway conditions |
|
|
|
|
|
|
|
|
|
|
|
|
Not reported |
0 |
0 |
0 |
0 |
0 |
0 |
0 |
0 |
0 |
0 |
0 |
0 |
Wet or icy pavement |
0 |
4 |
1 |
5 |
1.7 |
3 |
1 |
0 |
1 |
0 |
5 |
1.1 |
Weather conditions |
|
|
|
|
|
|
|
|
|
|
|
|
Dark/lighted |
3 |
2 |
1 |
6 |
2 |
0 |
1 |
0 |
1 |
0 |
2 |
0.4 |
Clear |
— |
— |
— |
— |
— |
3 |
2 |
0 |
5 |
0 |
10 |
2.2 |
Cloudy |
— |
— |
— |
— |
— |
1 |
0 |
1 |
0 |
0 |
2 |
0.4 |
Rain |
— |
— |
— |
— |
— |
1 |
0 |
0 |
1 |
0 |
2 |
0.4 |
Snow |
— |
— |
— |
— |
— |
0 |
0 |
0 |
0 |
0 |
0 |
0 |
Crashes during weekday peak periods1 |
4 |
6 |
2 |
12 |
4 |
3 |
0 |
0 |
3 |
0 |
6 |
1.3 |
Crashes involving pedestrian(s) |
— |
— |
— |
— |
— |
0 |
0 |
0 |
0 |
0 |
0 |
0 |
Crashes involving bicyclist(s) |
— |
— |
— |
— |
— |
0 |
0 |
0 |
0 |
0 |
0 |
0 |
Total crashes |
10 |
10 |
7 |
27 |
9 |
5 |
2 |
1 |
6 |
0 |
14 |
3.1 |
1 Peak periods are defined as 7:00–10:00 AM and 3:30–6:30 PM. 2 The number of crashes in 2008 only includes crashes that occurred after construction was complete in summer 2008. 3 The average number of crashes in the after period is averaged across 4.58 years.
Source: Central Transportation Planning Staff.
MPO staff collected turning-movement counts at the three intersections on June 19, 2014, while school was still in session. The data were recorded in 15-minute intervals for the morning peak period from 7:00 to 9:00 AM and the evening peak period from 4:00 to 6:00 PM. See Appendix A for traffic count summaries. Tables 4 through 6 compare traffic volumes for three separate years for each intersection; representing the following scenarios:
Comparing the before and projected conditions to after conditions indicates that in general, the expected traffic growth did not occur at the three study intersections. In fact, from 1997 to 2014, overall traffic volumes either remained relatively the same or decreased slightly, except for the PM peak hour at Pleasant Street/Concord Avenue, where volumes increased slightly. However, some of the individual turning movements did increase.
At the intersection of Pleasant Street/Concord Avenue, there was a 13% decrease in total traffic volumes in the AM peak hour and a 13% increase in the PM peak hour. At Pleasant Street at Leonard/Clifton Street, total traffic volumes decreased by 17% and 2% in the AM and PM peak hours, respectively. Pleasant Street at Brighton Street experienced a 2% increase in total volumes in the AM peak hour and a 7% decrease in the PM peak hour.
TABLE 4
Traffic Volume Comparisons
Intersection of Pleasant Street (EB/WB) at Concord Avenue (NB/SB)
N/A |
N/A |
EB |
N/A |
N/A |
WB |
N/A |
N/A |
NB |
N/A |
N/A |
SB |
N/A |
N/A |
|---|---|---|---|---|---|---|---|---|---|---|---|---|---|
Scenario |
LT |
TH |
RT |
LT |
TH |
RT |
LT |
TH |
RT |
LT |
TH |
RT |
Total |
AM - 1997 (Before) |
16 |
333 |
121 |
40 |
521 |
49 |
169 |
167 |
35 |
49 |
359 |
15 |
1,874 |
AM - 2017 (Projected) |
18 |
368 |
134 |
44 |
576 |
54 |
187 |
185 |
28 |
54 |
397 |
16 |
2,061 |
AM - 2014 (After) |
34 |
260 |
82 |
39 |
469 |
46 |
156 |
152 |
15 |
37 |
346 |
— |
1,636 |
PM - 1997 (Before) |
18 |
495 |
155 |
30 |
370 |
21 |
138 |
269 |
35 |
23 |
160 |
12 |
1,726 |
PM - 2017 (Projected) |
20 |
547 |
171 |
33 |
409 |
23 |
152 |
297 |
39 |
25 |
171 |
13 |
1,900 |
PM - 2014 (After) |
61 |
440 |
142 |
40 |
431 |
27 |
118 |
350 |
31 |
33 |
284 |
— |
1,957 |
N/A |
N/A |
EB |
N/A |
N/A |
WB |
N/A |
N/A |
NB |
N/A |
N/A |
SB |
N/A |
N/A |
|---|---|---|---|---|---|---|---|---|---|---|---|---|---|
Scenario |
LT |
TH |
RT |
LT |
TH |
RT |
LT |
TH |
RT |
LT |
TH |
RT |
Total |
AM - 1997 (Before) |
37 |
452 |
12 |
389 |
521 |
8 |
10 |
272 |
205 |
3 |
502 |
116 |
2,527 |
AM - 2017 (Projected) |
41 |
499 |
13 |
430 |
576 |
9 |
11 |
301 |
227 |
3 |
555 |
128 |
2,793 |
AM - 2014 (After) |
54 |
252 |
5 |
206 |
620 |
11 |
17 |
225 |
157 |
10 |
400 |
136 |
2,093 |
PM - 1997 (Before) |
82 |
486 |
9 |
202 |
310 |
7 |
18 |
472 |
220 |
11 |
320 |
41 |
2,178 |
PM - 2017 (Projected) |
91 |
537 |
10 |
223 |
342 |
8 |
20 |
522 |
243 |
12 |
354 |
45 |
2,407 |
PM - 2014 (After) |
84 |
348 |
13 |
203 |
423 |
39 |
17 |
416 |
138 |
9 |
364 |
79 |
2,133 |
Intersection of Pleasant Street (EB/WB) at Brighton Street (NB/SB)
N/A |
N/A |
EB |
N/A |
N/A |
WB |
N/A |
N/A |
NB |
N/A |
N/A |
SB |
N/A |
N/A |
|---|---|---|---|---|---|---|---|---|---|---|---|---|---|
Scenario |
LT |
TH |
RT |
LT |
TH |
RT |
LT |
TH |
RT |
LT |
TH |
RT |
Total |
AM - 1997 (Before) |
6 |
482 |
39 |
477 |
719 |
12 |
68 |
10 |
237 |
23 |
20 |
11 |
2,104 |
AM - 2017 (Projected) |
7 |
533 |
43 |
527 |
794 |
13 |
75 |
11 |
262 |
25 |
22 |
12 |
2,324 |
AM - 2014 (After) |
1 |
422 |
23 |
366 |
768 |
18 |
41 |
23 |
426 |
23 |
31 |
5 |
2,147 |
PM - 1997 (Before) |
3 |
621 |
26 |
332 |
515 |
24 |
58 |
25 |
460 |
17 |
15 |
4 |
2,100 |
PM - 2017 (Projected) |
3 |
686 |
29 |
367 |
569 |
27 |
64 |
28 |
508 |
19 |
17 |
4 |
2,321 |
PM - 2014 (After) |
5 |
424 |
31 |
408 |
583 |
13 |
37 |
26 |
373 |
19 |
18 |
8 |
1,945 |
Source: Central Transportation Planning Staff.
Staff analyzed intersection capacity and traffic operations with the intersection analysis program Synchro2. The 1997 before existing conditions, 2020 projected conditions, and 2014 after conditions were analyzed using the turning-movement counts and signal timing data. The FDR analysis was updated to be consistent with the most recent Highway Capacity Manual (HCM). The HCM was significantly updated in 2010 to incorporate current methodologies that engineers and planners use to assess traffic and environmental effects of highway projects. Both AM and PM peak hours were studied for the three study intersections. Both the delay and LOS results are illustrated in Tables 5-7.
As shown in Table 5, the intersection of Pleasant Street at Concord Avenue was projected to operate at LOS D in the AM peak hour and LOS C in the PM peak hour using the HCM 2010 methodology. The FDR projected that the intersection would operate at LOS D in the AM peak hour and LOS B in the PM peak hour. The intersection currently operates at LOS C in the AM peak hour and LOS D in the PM peak hour. The eastbound approach on Pleasant Street operates at a LOS F in the PM peak hour because of the diversion of eastbound left turns to the primary intersection; whereas eastbound left turns in the before condition occurred approximately 100 feet west of the intersection.
The intersection of Pleasant Street at Clifton/Leonard Street was projected to operate at LOS E in the AM peak hour and LOS D in the PM peak hour. The intersection currently operates at LOS C in both the AM and PM peak hours. Both peak hours operate at less than the projected level of service, which may be a result of the less-than-expected traffic growth at this intersection.
The intersection capacity analysis for the intersection of Pleasant Street at Brighton Street is shown in Table 7. This intersection was projected to operate at LOS B in the AM peak hour and LOS C in the PM peak hour. Pleasant Street at Brighton Street currently operates at LOS B in both the AM and PM peak hours.
TABLE 5
LOS Comparison – Intersection of Pleasant Street at Concord Avenue
|
|
N/A |
Before1 |
N/A |
N/A |
Projected2 |
N/A |
N/A |
After3 |
N/A |
|---|---|---|---|---|---|---|---|---|---|---|
Intersection / Approach |
Movement |
LOS |
Delay4 |
95% Q5 |
LOS |
Delay |
95% Q |
LOS |
Delay |
95% Q |
AM Peak Period |
N/A |
N/A |
N/A |
N/A |
N/A |
N/A |
N/A |
N/A |
N/A |
N/A |
Pleasant St. – EB |
TR (LTR) |
B |
17.2 |
292 |
B |
16.1 |
285 |
B |
18.2 |
234 |
Pleasant St. – WB |
LTR |
C |
22.0 |
453 |
C |
25.2 |
491 |
C |
22.9 |
394 |
Concord Ave. – NB |
L |
E |
68.9 |
#196 |
D |
49.6 |
#174 |
D |
39.3 |
#114 |
Concord Ave. – NB |
TR |
B |
17.9 |
117 |
B |
19.2 |
139 |
B |
19.2 |
113 |
Concord Ave. – SB |
L |
B |
16.4 |
40 |
C |
29.3 |
60 |
C |
30.7 |
41 |
Concord Ave. – SB |
TR |
C |
24.2 |
236 |
E |
79.9 |
#427 |
E |
62.3 |
#373 |
Overall |
— |
C |
25.2 |
— |
D |
35.9 |
— |
C |
30.8 |
— |
PM Peak Period |
N/A |
N/A |
N/A |
N/A |
N/A |
N/A |
N/A |
N/A |
N/A |
N/A |
Pleasant St. – EB |
TR (LTR) |
B |
15.0 |
412 |
B |
18.0 |
467 |
F |
80.3 |
#688 |
Pleasant St. – WB |
LTR |
B |
11.9 |
234 |
B |
15.0 |
277 |
C |
28.9 |
400 |
Concord Ave. – NB |
L |
C |
25.2 |
103 |
C |
24.4 |
110 |
B |
17.8 |
76 |
Concord Ave. – NB |
TR |
C |
26.9 |
200 |
C |
26.0 |
241 |
C |
20.3 |
247 |
Concord Ave. – SB |
L |
B |
18.4 |
25 |
C |
29.7 |
35 |
C |
26.8 |
37 |
Concord Ave. – SB |
TR |
C |
20.5 |
105 |
D |
38.2 |
161 |
D |
36.4 |
236 |
Overall |
— |
B |
17.9 |
— |
C |
21.4 |
— |
D |
45.2 |
— |
1 1997 “before” existing traffic volumes from FDR. 2 2017 “projected” future traffic volumes with build conditions from FDR. 3 2014 “after” existing traffic volumes. 4 Delay is measured in seconds. 5 Queue length is measured in feet.
Notes: (x) Turning lane configuration in Projected/After conditions. # = 95th percentile volume exceeds capacity; queues may be longer.
Source: Central Transportation Planning Staff.
TABLE 6
LOS Comparison – Intersection of Pleasant Street at Clifton/Leonard Street
N/A |
N/A |
N/A |
Before1 |
N/A |
N/A |
Projected2 |
N/A |
N/A |
After3 |
N/A |
|---|---|---|---|---|---|---|---|---|---|---|
Intersection / Approach |
Movement |
LOS |
Delay4 |
95% Q5 |
LOS |
Delay |
95% Q |
LOS |
Delay |
95% Q |
AM Peak Period |
N/A |
N/A |
N/A |
N/A |
N/A |
N/A |
N/A |
N/A |
N/A |
N/A |
Pleasant St. – EB |
(L) |
— |
— |
— |
C |
28.9 |
50 |
D |
44.8 |
#76 |
Pleasant St. – EB |
LTR (TR) |
F |
228.6 |
#685 |
F |
135.7 |
#611 |
D |
39.5 |
#244 |
Pleasant St. – WB |
L |
E |
67.5 |
#419 |
F |
81.4 |
#446 |
B |
16.5 |
120 |
Pleasant St. – WB |
TR |
C |
20.0 |
353 |
B |
18.1 |
356 |
C |
24.5 |
460 |
Leonard St. – NB |
LT |
C |
24.1 |
207 |
D |
39.3 |
#315 |
C |
20.7 |
167 |
Leonard St. – NB |
R |
A |
3.9 |
44 |
A |
5.4 |
67 |
A |
1.3 |
19 |
Clifton St. – SB |
LTR |
D |
43.9 |
#587 |
E |
58.1 |
#667 |
D |
37.8 |
#506 |
Overall |
— |
E |
76.1 |
— |
E |
61.7 |
— |
C |
27.4 |
— |
PM Peak Period |
N/A |
N/A |
N/A |
N/A |
N/A |
N/A |
N/A |
N/A |
N/A |
N/A |
Pleasant St. – EB |
(L) |
— |
— |
— |
C |
23.7 |
84 |
C |
31.0 |
80 |
Pleasant St. – EB |
LTR (TR) |
E |
60.1 |
#627 |
E |
66.9 |
#610 |
D |
43.0 |
#368 |
Pleasant St. – WB |
L |
B |
12.7 |
90 |
C |
26.8 |
#157 |
B |
12.9 |
97 |
Pleasant St. – WB |
TR |
B |
10.4 |
138 |
B |
13.1 |
177 |
B |
13.3 |
243 |
Leonard St. – NB |
LT |
E |
69.0 |
#566 |
D |
45.8 |
#552 |
D |
38.5 |
#393 |
Leonard St. – NB |
R |
B |
14.5 |
119 |
A |
6.1 |
78 |
A |
1.7 |
11 |
Clifton St. – SB |
LTR |
F |
101.3 |
#483 |
D |
39.3 |
#406 |
D |
51.0 |
#449 |
Overall |
— |
D |
53.8 |
— |
D |
38.3 |
— |
C |
30.9 |
— |
1 1997 “before” existing traffic volumes from FDR. 2 2017 “projected” future traffic volumes with Build Conditions from FDR. 3 2014 “after” existing traffic volumes. 4 Delay is measured in seconds. 5 Queue length is measured in feet.
Notes: (x) Turning lane configuration in Projected/After conditions. # = 95th percentile volume exceeds capacity; queues may be longer.
Source: Central Transportation Planning Staff.
TABLE 7
LOS Comparison – Intersection of Pleasant Street at Brighton Street
N/A |
N/A |
N/A |
Before1 |
N/A |
N/A |
Projected2 |
N/A |
N/A |
After3 |
N/A |
|---|---|---|---|---|---|---|---|---|---|---|
Intersection / Approach |
Movement |
LOS |
Delay4 |
95% Q5 |
LOS |
Delay |
95% Q |
LOS |
Delay |
95% Q |
AM Peak Period |
N/A |
N/A |
N/A |
N/A |
N/A |
N/A |
N/A |
N/A |
N/A |
N/A |
Pleasant St. – EB |
LTR |
D |
35.3 |
#540 |
C |
33.4 |
#518 |
C |
28.5 |
354 |
Pleasant St. – WB |
L |
B |
12.6 |
244 |
B |
16.8 |
277 |
A |
7.8 |
114 |
Pleasant St. – WB |
TR |
A |
7.2 |
311 |
A |
8.6 |
336 |
B |
13.1 |
399 |
Brighton St. – NB |
L (TL) |
D |
41.5 |
81 |
D |
47.6 |
98 |
D |
47.8 |
88 |
Brighton St. – NB |
TR (R) |
B |
12.7 |
67 |
A |
7.2 |
87 |
B |
12.9 |
26 |
Brighton St. – SB |
LTR |
F |
95.0 |
#75 |
C |
32.6 |
61 |
D |
41.1 |
50 |
Overall |
— |
C |
20.0 |
— |
B |
18.8 |
— |
B |
17.8 |
— |
PM Peak Period |
N/A |
N/A |
N/A |
N/A |
N/A |
N/A |
N/A |
N/A |
N/A |
N/A |
Pleasant St. – EB |
LTR |
C |
23.5 |
490 |
C |
32.8 |
#605 |
C |
26.4 |
356 |
Pleasant St. – WB |
L |
A |
9.2 |
118 |
B |
16.2 |
189 |
B |
13.4 |
163 |
Pleasant St. – WB |
TR |
A |
6.4 |
213 |
A |
8.2 |
235 |
A |
8.2 |
284 |
Brighton St. – NB |
L (TL) |
D |
35.6 |
65 |
D |
35.6 |
94 |
D |
36.6 |
75 |
Brighton St. – NB |
TR (R) |
B |
16.8 |
136 |
B |
18.0 |
280 |
B |
10.1 |
75 |
Brighton St. – SB |
LTR |
E |
64.1 |
48 |
C |
28.9 |
45 |
C |
27.6 |
50 |
Overall |
— |
B |
16.4 |
— |
C |
20.6 |
— |
B |
15.5 |
— |
1 1997 “Before” existing traffic volumes from FDR. 2 2017 “-Projected” future traffic volumes with Build Conditions from FDR. 3 2014 “After” existing traffic volumes. 4 Delay is measured in seconds. 5 Queue length is measured in feet.
Notes: (x) Turning lane configuration in Projected/After conditions. # 95th percentile volume exceeds capacity, queues may be longer.
Source: Central Transportation Planning Staff.
Route 138 is an urban principal arterial that runs north-south connecting Canton with Stoughton to the south and I-93 to the north. The surrounding land use includes residential, commercial, recreational, and educational institutions. Randolph Street is an urban minor arterial that runs east west, connecting the Town of Canton with the Town of Randolph to the east. Route 138 intersects with Washington Street approximately three-quarter miles north of Randolph Street. Washington Street is a primary route that connects residents of Canton with I-93 to access downtown Boston. The roadway improvements in the Canton FDR were associated with construction of the Reebok World Headquarters, which included building approximately 460,000 square feet of corporate office space. The development occurred approximately one mile north of Washington Street in Canton, along Route 138 between Royall Street and I-93. The study area is illustrated in Figure 7.
The following sections provide a summary of the before-and-after conditions, along with a comparison of crash data, traffic volumes, and traffic analysis at these two signalized intersections along the Route 138 corridor.
Route 138 at Randolph Street was a four-legged intersection controlled by a three-phase traffic signal with an exclusive pedestrian phase. Crosswalks existed on the Route 138 approach and the westbound Randolph Street approach, but no other bicycle or pedestrian facilities existed. Route 138 and Randolph Street were both marked as two-lane roadways, with a single lane to accommodate all traffic movements on each approach, as shown in Figure 8. The speed limit along Route 138 is 40 miles per hour (mph), and the speed limit along Randolph Street is 25 mph near this intersection. Steep grades existed on all approaches to the intersection, and traffic signal heads were located on overhead mast arms at each corner of the intersection.
The crash rate before reconstruction of the intersection was 1.58 crashes per million entering vehicles, which is higher than the MassDOT District 6 average crash rate of 0.76. According to the FDR, an average of 20 crashes occurred per year at this intersection during the three-year analysis period. The intersection operated at an overall LOS F in the AM and PM peak hours. Because of the high crash rate and poor intersection operations at this location, the recommendations aimed to improve intersection safety and traffic operations.
FIGURE 7
Canton Study Area
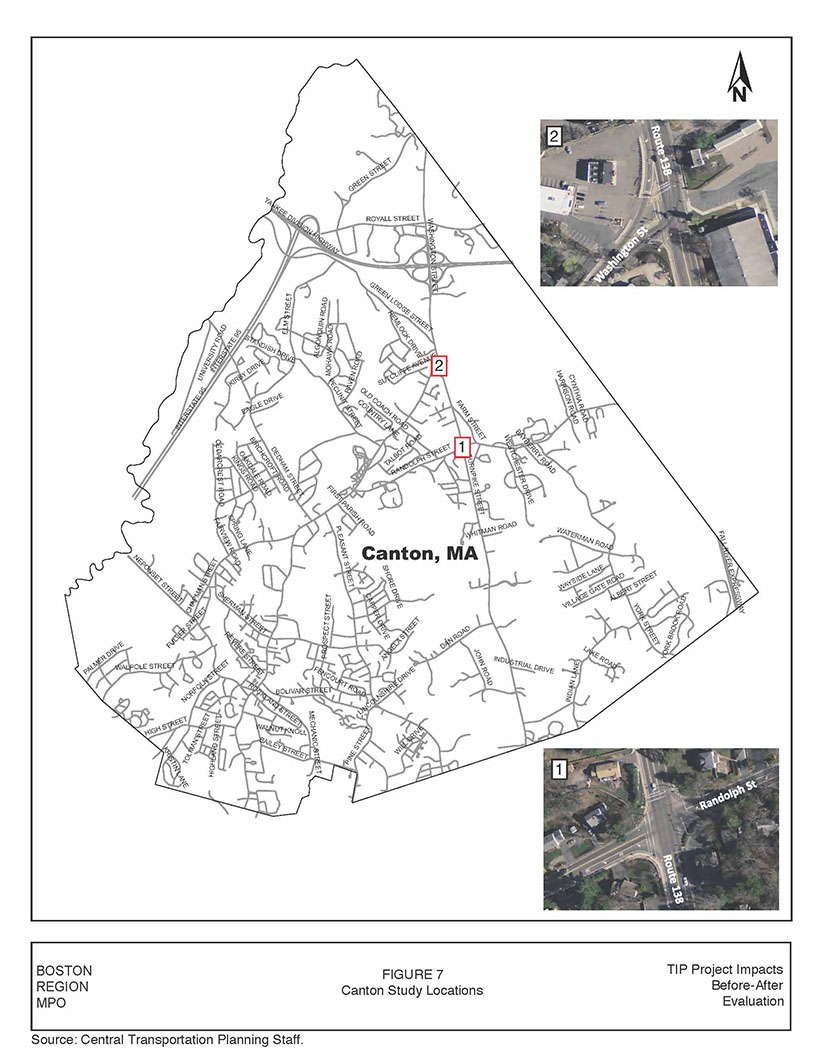
FIGURE 8
Before-and-After Reconstruction of Route 138 at Randolph Street
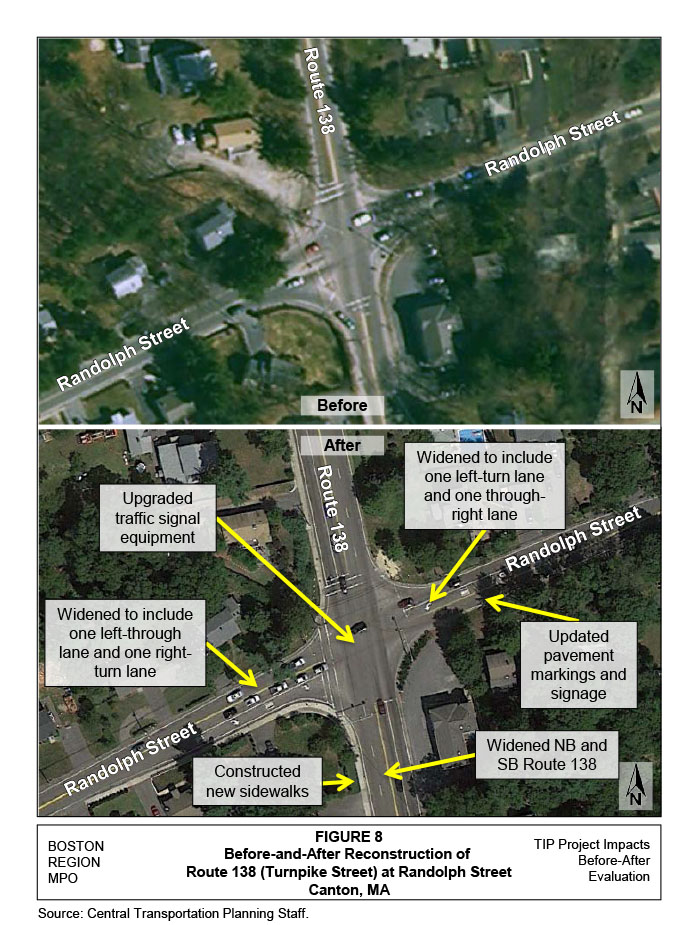
Reconstruction at Route 138 at Randolph Street included widening and restriping the northbound and southbound approaches of Route 138 to provide two 11.5-foot travel lanes. Both the northbound and southbound approaches currently provide a shared left-through lane and a shared through-right lane. The reconstruction also included widening and restriping the eastbound Randolph Street approach to provide one 11.5-foot shared left-through lane and one 11.5-foot exclusive right-turn lane. In addition, widening and restriping the Randolph Street westbound approach now provides for one exclusive 11.5-foot left-turn lane and one 11.5-foot shared through-right lane. Lastly, a sidewalk on the west side of Route 138 was constructed and a shared bicycle shoulder was provided on both sides of Route 138.
Traffic control at this intersection was upgraded to accommodate the modified geometry on all four approaches. A protected lead southbound left-turn phase was provided for the Route 138 approach and a leading westbound left-turn phase was provided for the Randolph Street approach to allow more green time to the respective approaches. The pushbutton-activated exclusive pedestrian phase remained as it was prior to reconstruction. Existing signs and pavement markings were updated to match the reconfigured intersection geometry.
The crash rate for the years 2008 to 2012 is 0.75 crashes per million entering vehicles, which is half that before the improvements were made, and is below the MassDOT District 6 average rate of 0.76 at signalized intersections. The analysis of current conditions shows an improvement of traffic operations in the AM peak hour from LOS F to LOS E. Although an LOS F remains in the PM peak hour, the average intersection delay was reduced by half. Thus, the modified geometry and traffic signals improved both safety and operations at this intersection.
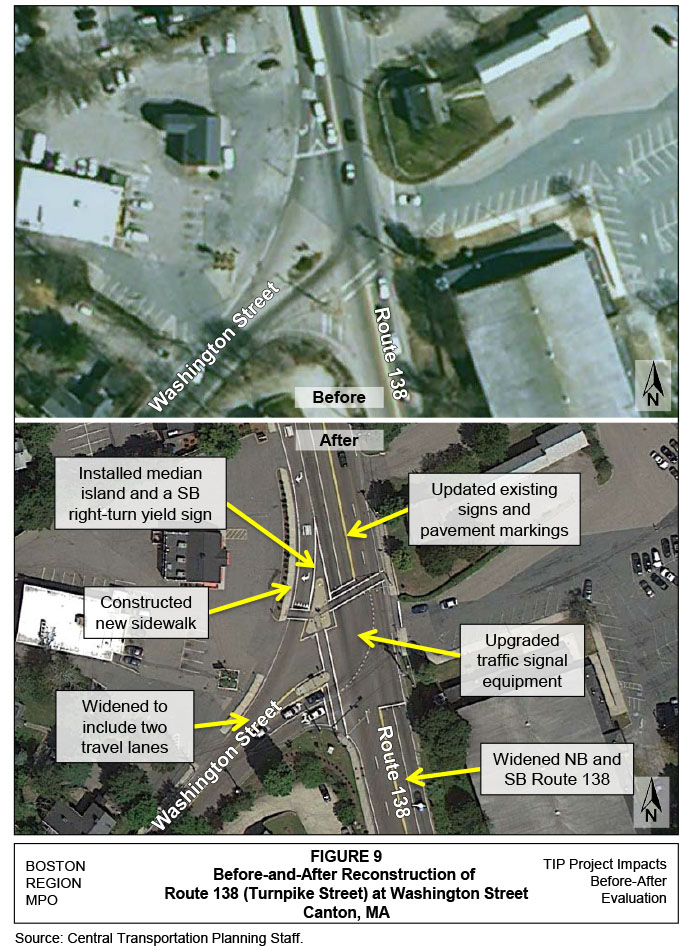
Route 138 at Washington Street was a four-legged intersection, with Washington Street intersecting Route 138 from the southwest, and the MDC Ponkapoag Golf Course exit driveway intersecting from the east. Several driveways provide access to Crowell’s Market immediately to the west of the intersection. Route 138 provides access to I-93 approximately one mile north of this intersection. A crosswalk was provided on the northbound Route 138 approach, but no additional bicycle or pedestrian accommodations were provided at this intersection. The southbound Route 138 approach provided one general-purpose lane, but operated as a through lane with a short right-turn lane. The other three approaches at the intersection operated with a single lane accommodating all traffic movements, as shown in Figure 9.
FIGURE 9
Before-and-After Reconstruction of Route 138 at Washington Street
The crash rate before reconstructing the intersection was 1.51 crashes per million entering vehicles, with an average of 21.7 crashes per year over three years; this was higher than the MassDOT District 6 average crash rate of 0.76. The intersection operated at an overall LOS F in the AM and PM peak hours. Because of the high crash rate at this location and poor intersection operations, the intersection recommendations were made to improve safety and traffic operations.
Reconstruction at Route 138 at Washington Street included widening and restriping of the northbound and southbound Route 138 approaches to provide two 11.5-feet travel lanes. After the improvements, the northbound approach operates with two lanes, with the left-most lane as a shared left-through. The southbound approach operates with two through lanes and an exclusive right-turn lane. The right-turn lane operates with yield control. Reconstruction also included widening and restriping the eastbound Washington Street approach to provide one 11.5-foot exclusive left-turn lane and one 11.5-foot shared left- and right-turn lane. Sidewalks were constructed on the west side of Route 138, and a shared shoulder for bicycle travel was provided on both sides of Route 138.
Traffic control at this intersection was upgraded to accommodate the modified geometry on the reconfigured approaches. The minor street approaches on Washington Street were converted to split phasing because of the high volume of minor street left turns. An exclusive pushbutton-activated pedestrian phase was provided on the eastbound Washington Street and southbound Route 138 approaches. Existing signs and pavement markings were updated to match the modified intersection geometry.
The crash rate for the years 2008 to 2012 is 0.57 crashes per million entering vehicles, which is well below the crash rate before the intersection improvements; the current rate is below the MassDOT District 6 average rate of 0.76 at signalized intersections. Analysis of current conditions shows an improvement of traffic operations in both the AM and PM peak hours. In the AM peak hour, LOS improved from LOS F to LOS C, and in the PM peak hour, it improved from LOS F to LOS B. Analysis shows that the modified geometry and traffic signal upgrades improved both safety and operations at this intersection.
Crash data from the Canton FDR (1997-99) were compared to current MassDOT RMV data for the most recent available five-year period, from 2008 to 2012. Tables 8 and 9 provide a summary of the crashes at the Route 138 at Randolph Street and Route 138 at Washington Street. Appendix C includes the collision diagrams for the two study intersections for the after period.
Sixty crashes occurred at the intersection of Route 138 at Randolph Street between 1997 and 1999. An average of 20 crashes occurred per year during this period. The total and average number of crashes in the after period, as shown in Tables 8 and 9, only include crashes that occurred after construction was complete in 2009. During this time, there were 27 total crashes, averaging 7.2 crashes per year. The average number of angle crashes decreased from 9.3 crashes per year to 2.1 crashes per year. The crash rate during before conditions was 1.58 crashes per million entering vehicles; whereas the crash rate decreased to 0.75 crashes per million vehicles in the after conditions. The crash rate for the years 2008 to 2012 is less than the District 6 average for signalized intersections.
Sixty-five crashes occurred at the intersection of Route 138 at Washington Street before reconstruction of the intersection. An average of 21.3 crashes occurred per year during this time. Twenty-seven crashes occurred in the after period, averaging 7.2 crashes per year. The average number of angle crashes decreased from 9.7 to 2.9 crashes per year, and rear-end crashes decreased from 8.3 to 2.1 crashes per year. The crash rate during the before conditions was 1.51 crashes per million entering vehicles and decreased to 0.57 crashes per million vehicles after reconstruction. The crash rate for the years 2008 to 2012 is less than the District 6 average for signalized intersections.
MPO staff collected turning-movement counts at the two Canton intersections on June 25, 2014, when school was still in session. Data were recorded in 15-minute intervals for the morning peak period from 7:00 to 9:00 AM and in the evening peak period from 4:00 to 6:00 PM. Please see Appendix A for traffic count summaries. See Table 10 for a comparison of the traffic volumes for three separate years for each intersection, represented by the following analytic scenarios:
TABLE 8
Crash Summary – Route 138 at Randolph Street
Crash Category |
1997-1999 Total |
1997-1999 Average |
2008 |
20092 |
2010 |
2011 |
2012 |
Total3 |
Average4 |
|---|---|---|---|---|---|---|---|---|---|
Crash severity |
N/A |
N/A |
N/A |
N/A |
N/A |
N/A |
N/A |
N/A |
N/A |
Property damage only |
44 |
14.7 |
10 |
7 |
2 |
6 |
9 |
24 |
6.4 |
Personal injury |
16 |
5.3 |
1 |
2 |
4 |
1 |
3 |
10 |
2.7 |
Fatality |
0 |
0 |
0 |
0 |
0 |
0 |
0 |
0 |
0 |
Collision type |
N/A |
N/A |
N/A |
N/A |
N/A |
N/A |
N/A |
N/A |
N/A |
Not reported |
9 |
3 |
1 |
0 |
0 |
0 |
0 |
0 |
0 |
Angle |
28 |
9.3 |
4 |
2 |
3 |
1 |
2 |
8 |
2.1 |
Rear-end |
22 |
7.3 |
3 |
3 |
1 |
4 |
7 |
15 |
4 |
Side-swipe |
— |
— |
1 |
2 |
2 |
2 |
2 |
8 |
2.1 |
Head-on |
1 |
0.3 |
0 |
2 |
0 |
0 |
0 |
2 |
0.5 |
Single-vehicle |
— |
— |
2 |
0 |
0 |
0 |
1 |
1 |
0.3 |
Roadway conditions |
N/A |
N/A |
N/A |
N/A |
N/A |
N/A |
N/A |
N/A |
N/A |
Not reported |
0 |
0 |
1 |
0 |
0 |
0 |
0 |
0 |
0 |
Wet or icy pavement |
16 |
5.3 |
0 |
2 |
2 |
3 |
5 |
12 |
3.2 |
Weather conditions |
N/A |
N/A |
N/A |
N/A |
N/A |
N/A |
N/A |
N/A |
N/A |
Dark/lighted |
— |
— |
4 |
3 |
2 |
2 |
4 |
11 |
2.9 |
Clear |
— |
— |
9 |
7 |
4 |
4 |
7 |
22 |
5.9 |
Cloudy |
— |
— |
2 |
1 |
1 |
3 |
0 |
5 |
1.3 |
Rain |
13 |
4.3 |
0 |
2 |
0 |
2 |
5 |
9 |
2.4 |
Snow |
3 |
1 |
0 |
0 |
1 |
1 |
0 |
2 |
0.5 |
Crashes during weekday peak periods1 |
30 |
10 |
1 |
3 |
2 |
2 |
6 |
13 |
3.5 |
Crashes involving pedestrian(s) |
— |
— |
0 |
0 |
0 |
0 |
0 |
0 |
0 |
Crashes involving bicyclist(s) |
— |
— |
0 |
0 |
0 |
0 |
0 |
0 |
0 |
Total crashes |
60 |
20 |
11 |
9 |
6 |
7 |
12 |
34 |
9.1 |
1 Peak periods are defined as 7:00–10:00 AM and 3:30–6:30 PM. 2 The number of crashes in year 2009 only includes crashes that occurred after construction was complete in Spring 2009. 3 Represents the total number of crashes in the After Period. 4 The crashes in the After Period are averaged across 3.75 years.
Source: Central Transportation Planning Staff.
TABLE 9
Crash Summary – Route 138 at Washington Street
Crash Category |
1997-1999 Total |
1997-1999 Average |
2008 |
20092 |
2010 |
2011 |
2012 |
Total3 |
Average4 |
|---|---|---|---|---|---|---|---|---|---|
Crash severity |
N/A |
N/A |
N/A |
N/A |
N/A |
N/A |
N/A |
N/A |
N/A |
Property damage only |
34 |
11.3 |
9 |
2 |
10 |
9 |
3 |
24 |
6.4 |
Personal injury |
31 |
10.3 |
4 |
0 |
1 |
1 |
1 |
3 |
0.8 |
Fatality |
0 |
0 |
0 |
0 |
0 |
0 |
0 |
0 |
0 |
Collision type |
N/A |
N/A |
N/A |
N/A |
N/A |
N/A |
N/A |
N/A |
N/A |
Not reported |
11 |
3.7 |
1 |
0 |
0 |
0 |
0 |
0 |
0 |
Angle |
29 |
9.7 |
1 |
0 |
5 |
5 |
1 |
11 |
2.9 |
Rear-end |
25 |
8.3 |
8 |
1 |
2 |
3 |
2 |
8 |
2.1 |
Side-swipe |
— |
— |
2 |
1 |
4 |
2 |
1 |
8 |
2.1 |
Head-on |
0 |
0 |
0 |
0 |
0 |
0 |
0 |
0 |
0 |
Single-vehicle |
— |
— |
1 |
0 |
0 |
0 |
0 |
0 |
0 |
Roadway conditions |
N/A |
N/A |
N/A |
N/A |
N/A |
N/A |
N/A |
N/A |
N/A |
Not reported |
4 |
1.3 |
0 |
0 |
0 |
0 |
0 |
0 |
0 |
Wet or icy pavement |
8 |
2.7 |
5 |
0 |
1 |
3 |
0 |
4 |
1.1 |
Weather conditions |
N/A |
N/A |
N/A |
N/A |
N/A |
N/A |
N/A |
N/A |
N/A |
Dark/lighted |
— |
— |
4 |
0 |
0 |
3 |
1 |
4 |
1.1 |
Clear |
— |
— |
6 |
2 |
9 |
8 |
4 |
23 |
6.1 |
Cloudy |
— |
— |
3 |
0 |
2 |
0 |
0 |
2 |
0.5 |
Rain |
8 |
2.7 |
3 |
0 |
0 |
3 |
0 |
3 |
0.8 |
Snow |
0 |
0 |
0 |
0 |
0 |
0 |
0 |
0 |
0 |
Crashes during weekday peak periods1 |
31 |
10.3 |
4 |
2 |
7 |
3 |
1 |
13 |
3.5 |
Crashes involving pedestrian(s) |
— |
— |
1 |
0 |
0 |
0 |
0 |
0 |
0 |
Crashes involving bicyclist(s) |
— |
— |
0 |
0 |
1 |
0 |
0 |
1 |
0.3 |
Total crashes |
65 |
21.3 |
13 |
2 |
11 |
10 |
4 |
27 |
7.2 |
1 Peak periods are defined as 7:00–10:00 AM and 3:30–6:30 PM. 2 The number of crashes in 2009 only includes crashes that occurred after construction was complete in spring 2009. 3 Represents the total number of crashes in the after period. 4 The crashes in the after period are averaged across 3.75 years.
Source: Central Transportation Planning Staff.
As shown in Table 10, overall traffic volumes grew slightly between the years 1997 and 2014, not as much, however, as predicted by the FDR. As illustrated in the table, some traffic movements, such as the eastbound Randolph Street through movement in the PM peak hour, grew significantly, while other movements, such as southbound through volumes at the Route 138/ Randolph Street intersection decreased significantly. Overall volumes grew by 6% and 14% in the AM peak hour, respectively, at Route 138 at Randolph Street. Overall volumes also grew at Washington Street, with an increase of 8% and 15% in the AM and PM peak hour, respectively.
TABLE 10
Traffic Volume Comparison
Intersection of Route 138 (NB/SB) at Randolph Street (EB/WB)
N/A |
N/A |
EB |
N/A |
N/A |
WB |
N/A |
N/A |
NB |
N/A |
N/A |
SB |
N/A |
N/A |
|---|---|---|---|---|---|---|---|---|---|---|---|---|---|
Scenario |
LT |
TH |
RT |
LT |
TH |
RT |
LT |
TH |
RT |
LT |
TH |
RT |
Total |
AM - 1997 (Before) |
45 |
260 |
240 |
185 |
295 |
40 |
85 |
420 |
75 |
35 |
735 |
105 |
2,520 |
AM - 2007 (Projected) |
56 |
267 |
246 |
190 |
302 |
82 |
87 |
641 |
77 |
41 |
825 |
108 |
2,922 |
AM - 2014 (After) |
20 |
257 |
166 |
168 |
370 |
115 |
141 |
552 |
91 |
98 |
645 |
44 |
2,667 |
PM - 1997 (Before) |
65 |
245 |
265 |
195 |
300 |
45 |
100 |
460 |
75 |
105 |
720 |
45 |
2,620 |
PM - 2007 (Projected) |
67 |
251 |
272 |
200 |
208 |
51 |
103 |
543 |
77 |
144 |
928 |
51 |
2,895 |
PM - 2014 (After) |
14 |
400 |
57 |
123 |
298 |
102 |
142 |
619 |
195 |
384 |
639 |
14 |
2,987 |
Intersection of Route 138 (NB/SB) at Washington Street (EB/WB)
N/A |
N/A |
EB |
N/A |
N/A |
WB |
N/A |
N/A |
NB |
N/A |
N/A |
SB |
N/A |
N/A |
|---|---|---|---|---|---|---|---|---|---|---|---|---|---|
Scenario |
LT |
TH |
RT |
LT |
TH |
RT |
LT |
TH |
RT |
LT |
TH |
RT |
Total |
AM - 1997 (Before) |
695 |
15 |
10 |
— |
— |
10 |
10 |
780 |
— |
— |
875 |
305 |
2,700 |
AM - 2007 (Projected) |
830 |
15 |
10 |
— |
— |
10 |
10 |
1,061 |
— |
— |
974 |
333 |
3,243 |
AM - 2014 (After) |
624 |
2 |
10 |
3 |
— |
8 |
8 |
1,047 |
1 |
— |
892 |
316 |
2,911 |
PM - 1997 (Before) |
485 |
10 |
15 |
10 |
25 |
5 |
35 |
795 |
5 |
5 |
795 |
510 |
2,695 |
PM - 2007 (Projected) |
538 |
10 |
15 |
10 |
26 |
5 |
36 |
892 |
36 |
9 |
1,046 |
615 |
3,238 |
PM - 2014 (After) |
379 |
1 |
43 |
6 |
8 |
24 |
21 |
810 |
— |
— |
1,201 |
600 |
3,093 |
Source: Central Transportation Planning Staff.
TABLE 11
LOS Comparison – Intersection of Route 138 at Randolph Street
N/A |
N/A |
N/A |
Before1 |
N/A |
N/A |
Projected2 |
N/A |
N/A |
After3 |
N/A |
|---|---|---|---|---|---|---|---|---|---|---|
Intersection / Approach |
Movement |
LOS |
Delay4 |
95% Q5 |
LOS |
Delay |
95% Q |
LOS |
Delay |
95% Q |
AM Peak Period |
N/A |
N/A |
N/A |
N/A |
N/A |
N/A |
N/A |
N/A |
N/A |
N/A |
Randolph St. – EB |
LTR (LT) |
F |
151.8 |
#541 |
E |
55.7 |
#333 |
E |
70.4 |
#330 |
Randolph St. – EB |
(R) |
— |
— |
— |
B |
16.1 |
124 |
A |
6.1 |
35 |
Randolph St. – WB |
(L) |
— |
— |
— |
D |
36.0 |
#146 |
D |
40.5 |
#121 |
Randolph St. – WB |
LTR (TR) |
F |
887.6 |
#591 |
C |
24.4 |
260 |
D |
37.9 |
#433 |
Route 138 – NB |
L |
F |
130.7 |
#138 |
— |
— |
— |
— |
— |
— |
Route 138 – NB |
TR (LTR) |
B |
16.5 |
263 |
C |
30.3 |
#305 |
F |
114.6 |
#458 |
Route 138 – SB |
L |
A |
7.2 |
19 |
— |
— |
— |
— |
— |
— |
Route 138 – SB |
TR (LTR) |
B |
18.5 |
473 |
B |
15.7 |
260 |
C |
27.7 |
#342 |
Overall |
— |
F |
229.8 |
— |
C |
26.7 |
— |
E |
59.4 |
— |
PM Peak Period |
N/A |
N/A |
N/A |
N/A |
N/A |
N/A |
N/A |
N/A |
N/A |
N/A |
Randolph St. – EB |
LTR (LT) |
F |
206.6 |
#589 |
D |
49.5 |
#314 |
E |
58.6 |
#433 |
Randolph St. – EB |
(R) |
— |
— |
— |
C |
21.4 |
163 |
A |
7.8 |
27 |
Randolph St. – WB |
(L) |
— |
— |
— |
C |
35.0 |
#149 |
D |
40.6 |
#99 |
Randolph St. – WB |
LTR (TR) |
F |
925.0 |
#616 |
C |
23.0 |
237 |
C |
26.8 |
285 |
Route 138 – NB |
L |
F |
94.3 |
#147 |
— |
— |
— |
— |
— |
— |
Route 138 – NB |
TR (LTR) |
B |
17.6 |
295 |
D |
37.6 |
#323 |
F |
219.9 |
#570 |
Route 138 – SB |
L |
B |
13.4 |
65 |
— |
— |
— |
— |
— |
— |
Route 138 – SB |
TR (LTR) |
B |
15.0 |
387 |
D |
47.9 |
#506 |
F |
98.6 |
#520 |
Overall |
— |
F |
248.1 |
— |
D |
39.3 |
— |
F |
119.0 |
— |
1 1997 “before” existing traffic volumes from FDR. 2 2007 “projected” future traffic volumes with build conditions from FDR. 3 2014 “after” existing traffic volumes. 4 Delay is measured in seconds. 5 Queue length is measured in feet.
Notes: (x) Turning lane configuration in Projected/After conditions. # = 95th percentile volume exceeds capacity; queues may be longer.
Source: Central Transportation Planning Staff.
TABLE 12
LOS Comparison – Intersection of Route 138 at Washington Street
N/A |
N/A |
N/A |
Before1 |
N/A |
N/A |
Projected2 |
N/A |
N/A |
After3 |
N/A |
|---|---|---|---|---|---|---|---|---|---|---|
Intersection / Approach |
Movement |
LOS |
Delay4 |
95% Q5 |
LOS |
Delay |
95% Q |
LOS |
Delay |
95% Q |
AM Peak Period |
N/A |
N/A |
N/A |
N/A |
N/A |
N/A |
N/A |
N/A |
N/A |
N/A |
Washington St. – EB |
(L) |
— |
— |
— |
D |
41.9 |
#420 |
D |
41.1 |
#317 |
Washington St. – EB |
LTR |
F |
170.2 |
#676 |
D |
40.2 |
#412 |
D |
41.4 |
#322 |
Washington St. – WB |
LTR |
A |
9.0 |
11 |
C |
20.9 |
18 |
C |
24.5 |
27 |
Route 138 – NB |
LTR |
F |
195.5 |
#733 |
B |
15.1 |
306 |
B |
19.2 |
355 |
Route 138 – SB |
TL (T) |
D |
36.3 |
#639 |
B |
13.4 |
257 |
B |
14.8 |
247 |
Route 138 – SB |
R |
A |
0.2 |
0 |
A |
0.3 |
0 |
A |
0.3 |
0 |
Overall |
— |
F |
114.4 |
— |
B |
19.8 |
— |
C |
20.8 |
— |
PM Peak Period |
N/A |
N/A |
N/A |
N/A |
N/A |
N/A |
N/A |
N/A |
N/A |
N/A |
Washington St. – EB |
(L) |
— |
— |
— |
D |
37.0 |
235 |
D |
35.8 |
175 |
Washington St. – EB |
LTR |
E |
66.7 |
#477 |
D |
35.6 |
227 |
C |
32.4 |
164 |
Washington St. – WB |
LTR |
B |
13.7 |
31 |
D |
35.0 |
51 |
C |
28.3 |
22 |
Route 138 – NB |
LTR |
F |
704.1 |
#810 |
B |
17.1 |
287 |
B |
15.7 |
235 |
Route 138 – SB |
TL (T) |
D |
35.1 |
#620 |
B |
16.1 |
306 |
B |
17.9 |
344 |
Route 138 – SB |
R |
A |
0.5 |
0 |
A |
0.9 |
0 |
A |
0.8 |
0 |
Overall |
— |
F |
241.5 |
— |
B |
17.2 |
— |
B |
16.5 |
— |
1 1997 “before” existing traffic volumes from FDR. 2 2007 “projected” future traffic volumes with build conditions from FDR. 3 2014 “after” existing traffic volumes. 4 Delay is measured in seconds. 5 Queue length is measured in feet.
Notes: (x) Turning lane configuration in projected/after conditions. # = 95th percentile volume exceeds capacity; queues may be longer.
Source: Central Transportation Planning Staff.
Route 138 at Randolph Street was projected to operate at LOS C in the AM peak hour and LOS D in the PM peak hour. The intersection is currently operating at LOS E in the AM peak hour and LOS F in the PM peak hour. The northbound Route 138 approach operates poorly in both peak hours based on the high number of northbound left turns and opposing southbound through volumes.
The intersection of Route 138 at Washington Street was projected to operate at LOS B in both the morning and evening peak hours. The intersection is currently operating at LOS C in the AM peak hour and LOS B in the PM peak hour.
King Street is an urban minor arterial that runs southwest-northeast connecting Franklin with Medway and Norfolk to the north and Woonsocket, Rhode Island to the south. For simplicity, we refer to King Street as an east-west roadway throughout this report. King Street intersects with I-495 within the project limits; and the speed limit is posted at 30 mph. The surrounding lane use is primarily commercial, with some residential usage in the vicinity. Please see Figure 10 for an illustration of the study area.
This project widened King Street to accommodate a consistent cross section of four lanes, with two lanes in both the east- and westbound directions. Concrete sidewalks and granite curbing was installed along the south side of King Street within the project limits. The pavement on King Street also was upgraded, along with new pavement markings and signage. The purpose of the Franklin FDR was to address existing and projected traffic safety and operational deficiencies experienced in the project area.
The following sections provide a summary of the before-and-after conditions, along with a comparison of crash data, traffic volumes, and traffic analysis at five intersections along the King Street corridor.
Upper Union Street intersected with Constitution Boulevard to form a three-way intersection, with the eastbound Constitution Boulevard approach controlled by a stop sign. This intersection is the main entrance to the Franklin Industrial Park. Both the north- and southbound Upper Union Street approaches have one general-purpose lane, as shown in Figure 11. The eastbound Constitution Boulevard approach also has one general-purpose lane with a raised median separating traffic flows along Constitution Boulevard. There were no pedestrian or bicycle accommodations at this intersection.
The crash rate before reconstructing the intersection was 0.45 crashes per million entering vehicles, which was below the District 3 average of 0.74 for unsignalized intersections. The eastbound Constitution Boulevard approach operated with LOS D and LOS F in the AM and PM peak hours, respectively.
FIGURE 10
Franklin Study Area
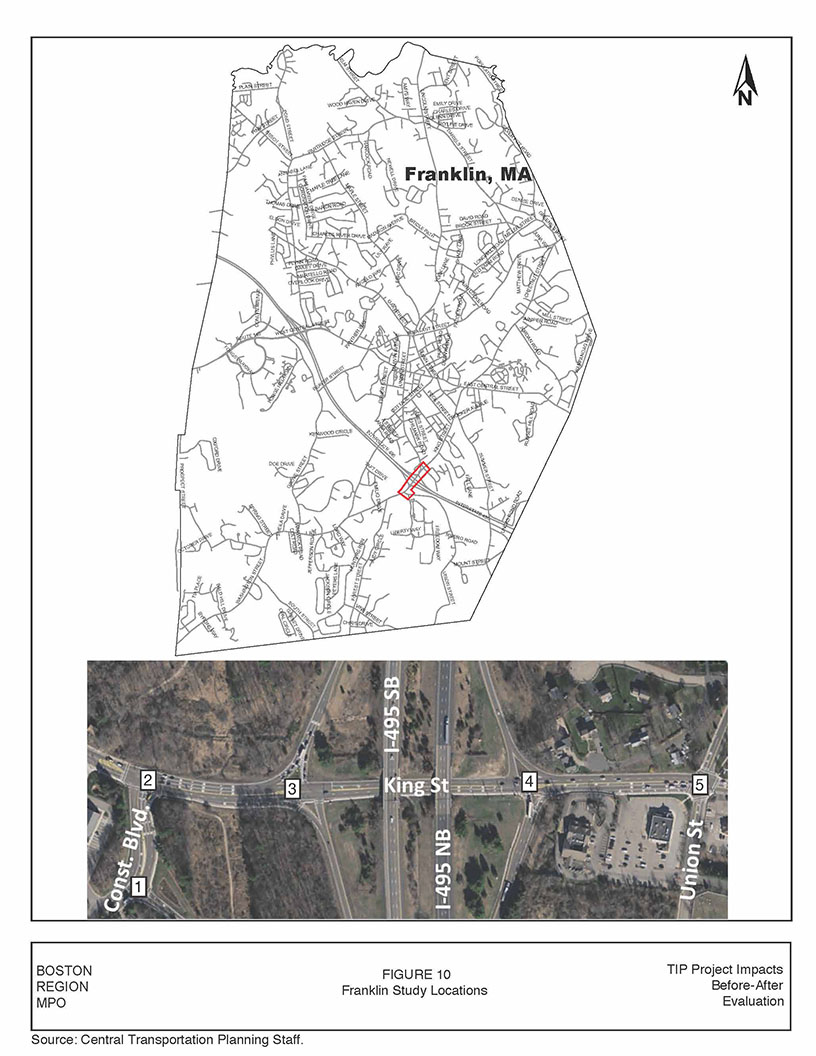
FIGURE 11
Before-and-After Reconstruction of Constitution Boulevard at Upper Union Street
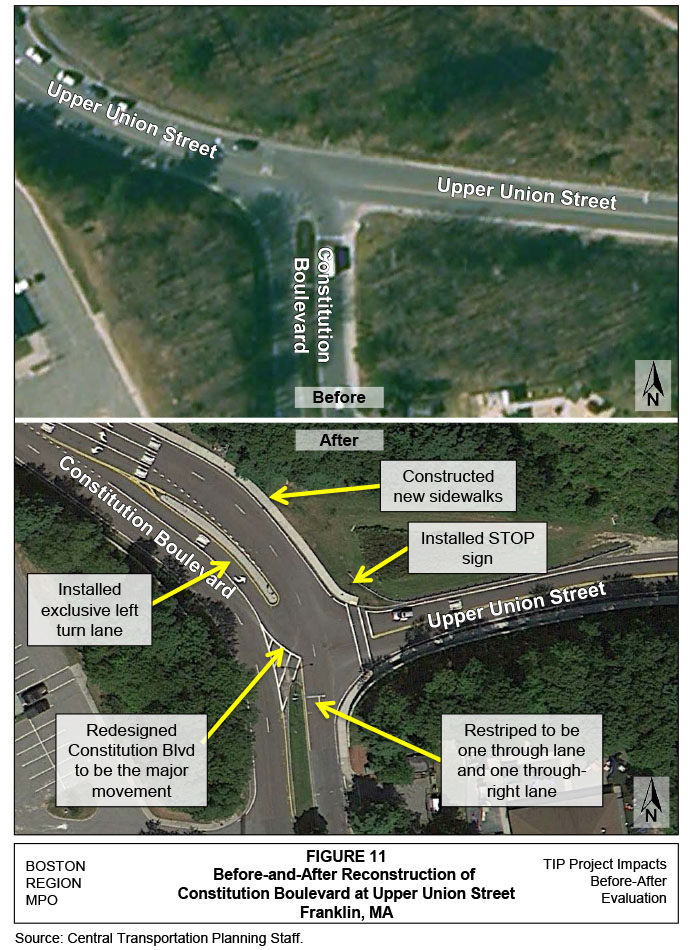
Upper Union Street at Constitution Boulevard was reconfigured such that Constitution Boulevard operates as the major traffic movement. After the improvements, the northbound Constitution Boulevard approach operates freely with one through lane and one through-right lane. The southbound Constitution Boulevard approach operates freely with two through lanes and one exclusive left-turn lane. The westbound Upper Union Street approach is stop sign controlled, with one right-turn only lane. A six-foot wide concrete sidewalk was constructed that extends along the east side of Constitution Boulevard from King Street to the south of Upper Union Street.
The crash rate for the years 2008 to 2012 is 0.27 crashes per million entering vehicles, which is well below the crash rate before the intersection improvements; the current rate is below the MassDOT District 3 average rate of 0.66 at unsignalized intersections. Analysis of current conditions shows improvement in traffic operations in both the AM and PM peak hours. The westbound Upper Union Street approach operates at LOS B in the AM peak hour, and the southbound Constitution Boulevard approach operates at LOS D in the PM peak hour.
Before reconstruction, King Street intersected with Upper Union Street to form a three-way signalized intersection. The eastbound King Street approach operated with one through lane and one exclusive right-turn lane onto Upper Union Street. Westbound King Street had one lane and one exclusive left-turn lane onto Upper Union Street. The northbound Upper Union Street approach had one exclusive left-turn lane and one exclusive right-turn lane. The driveway to Franklin Fire Station #2 is located roughly 100 feet west of this intersection and is controlled by a separate traffic signal with emergency preemption. Sidewalks were present on the south side of King Street along both approaches and on the north side of the eastbound King Street approach, as shown in Figure 12.
The crash rate before reconstruction was 0.19 crashes per million entering vehicles, which was below the District 3 average of 0.89 for signalized intersections. The eastbound Constitution Boulevard approach operated with LOS F in the AM peak hour and LOS E in the PM peak hour.
FIGURE 12
Before-and-After Reconstruction of King Street at Constitution Boulevard
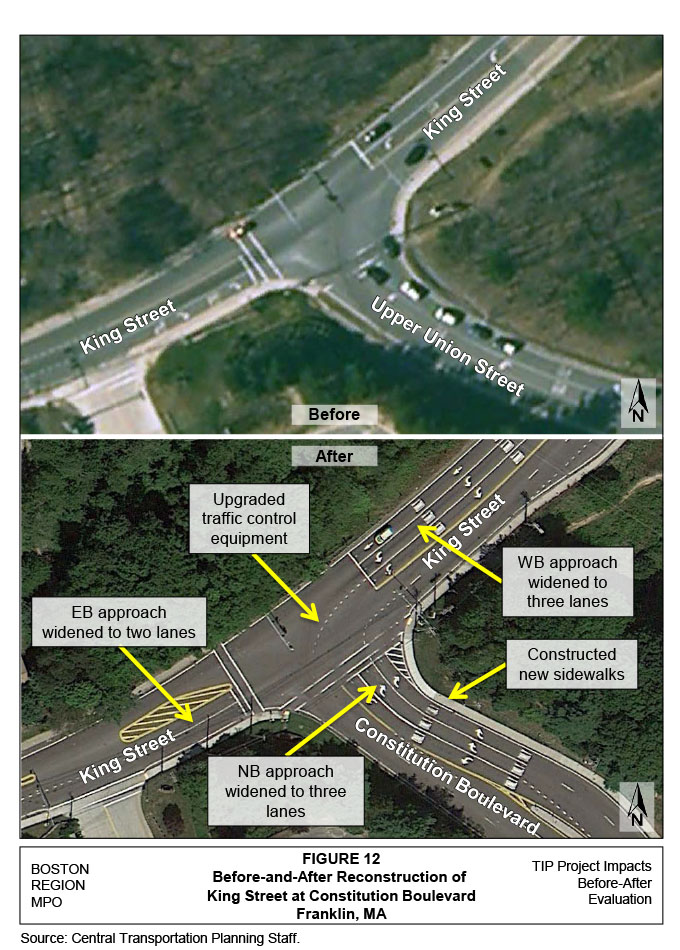
After reconstruction, the northbound approach is referred to and signed as Constitution Boulevard. The eastbound King Street approach was widened to two lanes and striped as one through lane and one through-right lane. The westbound King Street approach also was widened and now has one through lane and two exclusive left-turn lanes. The northbound Constitution Boulevard approach was widened to accommodate an exclusive left-turn lane and two exclusive right-turn lanes. The sidewalks in the before period were reconstructed; however, no new bicycle or pedestrian facilities were installed. In addition, the traffic signal was upgraded to accommodate the modified geometry and signal coordination along King Street. The crash rate in the after period is 0.31 crashes per million entering vehicles; analysis of current conditions shows that the intersection is operating at LOS D in both the AM and PM peak hours.
Prior to improvements, King Street intersected with the I-495 southbound ramps to form a four-way unsignalized intersection. The eastbound King Street approach operated with one through lane and one channelized limited-storage right-turn lane onto the I-495 southbound on-ramp. The westbound King Street approach had one through lane and one exclusive left-turn lane onto the I-495 southbound on-ramp. The I-495 southbound off ramp had one lane that split into one exclusive left- and right-turn lane, as shown in Figure 13. Sidewalks were present on the south side of King Street.
The crash rate at this intersection could not be calculated in the FDR as crashes around the I-495 Southbound Ramps were grouped together because of insufficient location data. This intersection operated at LOS F in both the AM and PM peak hours based on the high volumes on King Street; which caused departing vehicles from the I-495 southbound off ramp to experience high delays as they queued to wait for acceptable gaps on the unsignalized approach.
FIGURE 13
Before-and-After Reconstruction of King Street at I-495 SB Ramps
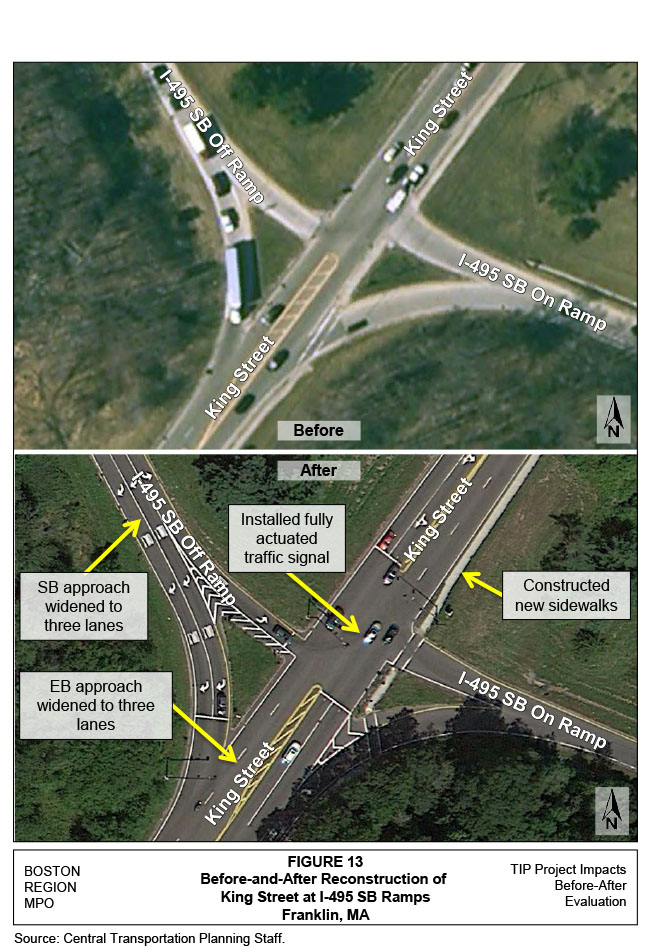
The King Street approaches at the I-495 Southbound Ramps were widened to accommodate one shared left-through lane, one dedicated through lane on the westbound approach, and two through lanes and one exclusive right-turn lane on the eastbound approach. The eastbound right-turn lane operates under yield-sign control. The southbound I-495 off ramp also was widened to accommodate one exclusive left-turn lane and two exclusive right-turn lanes. The sidewalks along the south side of King Street were reconstructed, but additional bicycle or pedestrian facilities were not provided. This intersection was converted to signalized operations, with the installation of a fully actuated traffic signal and mast arm-mounted traffic signal equipment. The crash rate in the after period is 0.21 crashes per million entering vehicles, and the analysis of current conditions shows that the intersection is operating at LOS C in both the AM and PM peak hours.
King Street intersected with the I-495 northbound ramps to form a four-way unsignalized intersection before reconstruction. The eastbound King Street approach had one through lane and one exclusive left-turn lane, and the westbound King Street approach had one shared through-right lane. The channelized westbound right turn operated with yield-sign control and had limited storage. The I-495 northbound off ramp had one lane that split into one exclusive left- and right-turn lane, as shown in Figure 14. The northbound approach was controlled by a stop sign. Sidewalks were present along the south side of King Street. The crash rate at this location could not be calculated in the FDR because of data restraints. The intersection operated at LOS F in both the AM and PM peak hours because of the unsignalized could not accommodate northbound demand.
The westbound King Street approach was widened to accommodate one through lane and one shared through-right lane. The eastbound King Street approach also was widened to include one exclusive left-turn lane and one dedicated through lane. The northbound I-495 off ramp was widened to accommodate two exclusive left-turn lanes and one exclusive right-turn lane. The northbound right-turn lane operates under yield control. The sidewalks along the south side of King Street were reconstructed, but new accommodations were not provided. A fully actuated traffic signal was installed with mast arm-mounted traffic signal equipment to address the operations issues at this intersection. The crash rate in the after period was 0.39 crashes per million entering vehicles, and analysis of current conditions shows that the intersection is operating at LOS E in both the AM and PM peak hours.
FIGURE 14
Before-and-After Reconstruction of King Street at I-495 NB Ramps
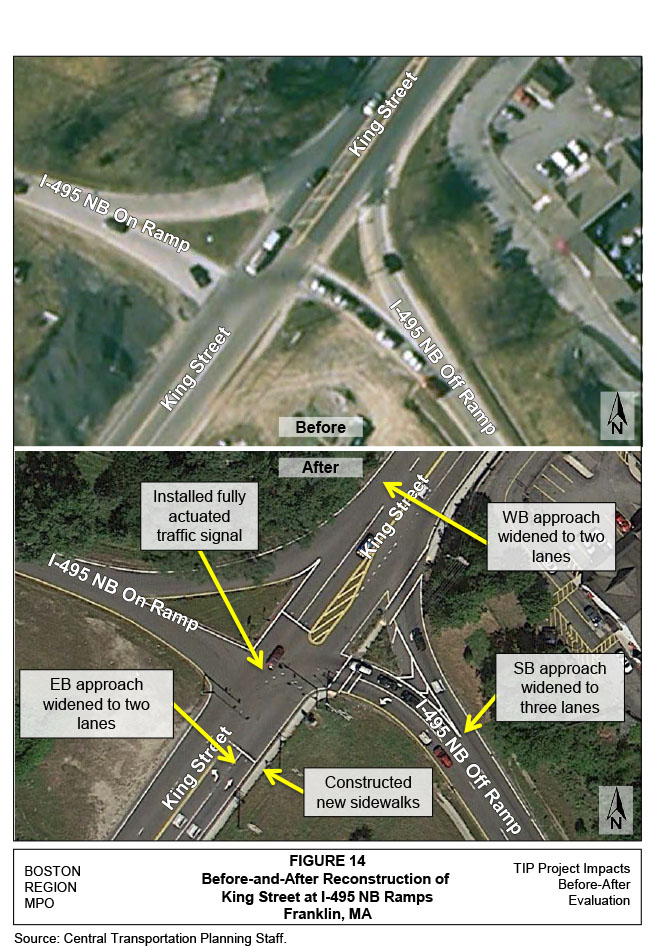
King Street intersected with Union Street to form a four-way signalized intersection just east of the I-495 ramps. The westbound and eastbound King Street approaches consisted of one left-turn lane and one shared through-right lane. The northbound Union Street approach had one left-turn lane and one shared through-right lane, and the southbound Union Street approach had one shared left-through lane and one right-turn lane. Please see Figure 15 for an illustration of the intersection. Sidewalks were present on the south side of the eastbound approach, the east side of the northbound approach, both sides of the westbound approach, and the west side of the southbound approach. A gas station was located at the southeast corner of the intersection, and a small shopping center existed at the southwest corner of the intersection. The crash rate was 0.71 crashes per million entering vehicles, which was slightly below the 2001 MassDOT District 3 average of 0.85 for signalized intersections. The intersection operated at LOS C and LOS D in the AM and PM peak hours, respectively.
King Street was widened to accommodate one eastbound exclusive left-turn lane, one through lane, and one exclusive right-turn lane. The westbound approach also was widened to accommodate two general-purpose lanes. Sidewalks were reconstructed, but additional pedestrian and bicycle accommodations were not provided. Traffic signals were modified for the updated geometry, and the signal was coordinated with adjacent signals along King Street within the project limits. The crash rate in the after period was 0.08 crashes per million entering vehicles. The intersection operates at LOS D in both the AM and PM peak hours, as projected by the FDR analysis.
FIGURE 15
Before-and-After Reconstruction of King Street at Union Street
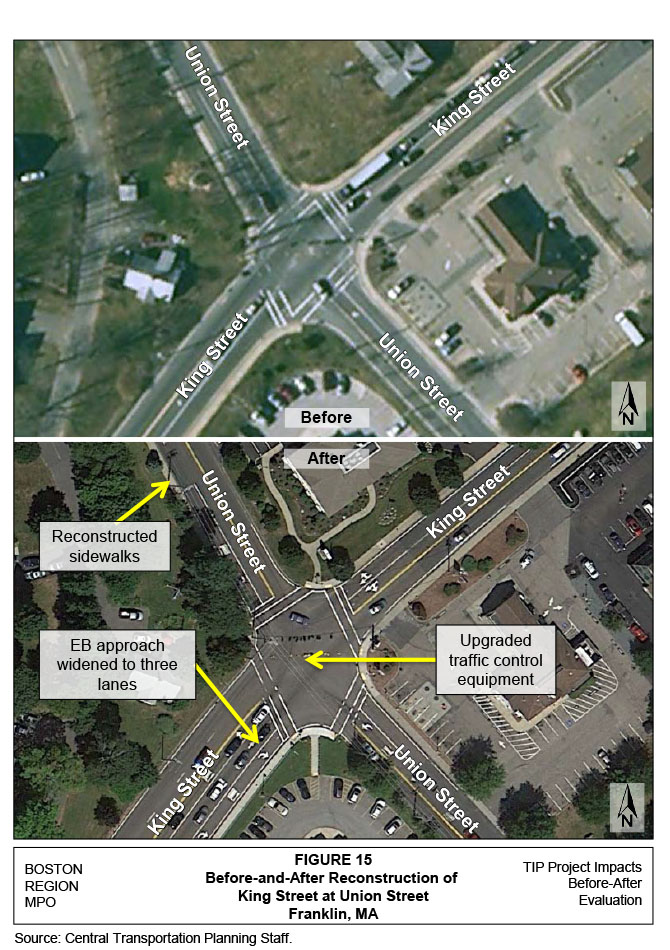
Crash data from the Franklin FDR (1997-99) were compared to current MassDOT RMV data for the most recent available five-year period, from 2008 to 2012. Tables 13-17 provide a summary of the crashes at the five intersection locations within the study area. Collision diagrams based on the after period data are located in Appendix C.
One crash occurred at the intersection of Constitution Boulevard at Upper Union Street between 1997 and 1999. The total and average number of crashes in the after period only includes crashes that occurred after construction was complete in 2010. There were four crashes during the after period, averaging 1.6 crashes per year. The crash rate in the before conditions was 0.45 crashes per million entering vehicles, decreasing to 0.27 crashes per million vehicles in the after conditions, which was significantly less than the District 3 average for unsignalized intersections.
Six crashes occurred at the intersection of King Street at Constitution Boulevard before reconstruction, averaging two crashes per year during this time. Nine crashed occurred in the after period, averaging 3.5 crashes per year. A greater number of rear-end collisions occurred in the after period. The crash rate increased from 0.19 to 0.31 crashes per million entering vehicles after reconstruction. The crash rate for 2008 to 2012 is less than the District 3 average for signalized intersections.
Because the crash data analyzed in the Franklin FDR only allowed an aggregate crash summary of the King Street at I-495 south- and northbound ramps, a before-and-after comparison could not be conducted. However, in the after period crash data still could be summarized. During the after period, seven crashes occurred with an average of 2.7 crashes per year at the I-495 southbound ramps. Angle and rear-end crashes were the most common crash type in this period. The crash rate was calculated to be 0.21 crashes per million entering vehicles. The King Street at I-495 northbound ramps experienced 12 crashes, averaging 4.7 crashes per year. Nearly 75% of the crashes were angle collisions; the crash rate was calculated to be 0.39 crashes per million entering vehicles.
Twenty crashes occurred at the intersection of King Street at Union Street before the intersection was reconfigured. Only two crashes occurred in the 2.58 years of available data after the construction was complete in 2010. The crash rate decreased from 0.71 to 0.08 crashes per million entering vehicles.
TABLE 13
Crash Summary – Constitution Boulevard at Upper Union Street
Crash Category |
1997 |
1998 |
1999 |
Total |
Average |
2008 |
2009 |
20102 |
2011 |
2012 |
Total3 |
Average4 |
|---|---|---|---|---|---|---|---|---|---|---|---|---|
Crash severity |
N/A |
N/A |
N/A |
N/A |
N/A |
N/A |
N/A |
N/A |
N/A |
N/A |
N/A |
N/A |
Property damage only |
0 |
0 |
1 |
1 |
0.3 |
0 |
1 |
0 |
4 |
0 |
4 |
1.6 |
Personal injury |
0 |
0 |
0 |
0 |
0 |
0 |
0 |
0 |
0 |
0 |
0 |
0 |
Fatality |
0 |
0 |
0 |
0 |
0 |
0 |
0 |
0 |
0 |
0 |
0 |
0 |
Collision type |
N/A |
N/A |
N/A |
N/A |
N/A |
N/A |
N/A |
N/A |
N/A |
N/A |
N/A |
N/A |
Not reported |
0 |
0 |
1 |
1 |
0.3 |
0 |
0 |
0 |
0 |
0 |
0 |
0 |
Angle |
0 |
0 |
0 |
0 |
0 |
0 |
1 |
0 |
2 |
0 |
2 |
0.8 |
Rear-end |
0 |
0 |
0 |
0 |
0 |
0 |
0 |
0 |
1 |
0 |
1 |
0.4 |
Side-swipe |
— |
— |
— |
— |
— |
0 |
0 |
0 |
0 |
0 |
0 |
0 |
Head-on |
0 |
0 |
0 |
0 |
0 |
0 |
0 |
0 |
0 |
0 |
0 |
0 |
Single-vehicle |
— |
— |
— |
— |
— |
0 |
0 |
0 |
1 |
0 |
1 |
0.4 |
Roadway conditions |
N/A |
N/A |
N/A |
N/A |
N/A |
N/A |
N/A |
N/A |
N/A |
N/A |
N/A |
N/A |
Not reported |
— |
— |
— |
— |
— |
0 |
0 |
0 |
1 |
0 |
1 |
0.4 |
Wet or icy pavement |
— |
— |
— |
— |
— |
0 |
0 |
0 |
0 |
0 |
0 |
0 |
Weather conditions |
N/A |
N/A |
N/A |
N/A |
N/A |
N/A |
N/A |
N/A |
N/A |
N/A |
N/A |
N/A |
Dark/lighted |
— |
— |
— |
— |
— |
0 |
0 |
0 |
1 |
0 |
1 |
0.4 |
Clear |
— |
— |
— |
— |
— |
0 |
1 |
0 |
2 |
0 |
2 |
0.8 |
Cloudy |
— |
— |
— |
— |
— |
0 |
0 |
0 |
2 |
0 |
2 |
0.8 |
Rain |
— |
— |
— |
— |
— |
0 |
0 |
0 |
0 |
0 |
0 |
0 |
Snow |
— |
— |
— |
— |
— |
0 |
0 |
0 |
0 |
0 |
0 |
0 |
Crashes during weekday peak periods1 |
— |
— |
— |
— |
— |
0 |
1 |
0 |
3 |
0 |
3 |
1.2 |
Crashes involving pedestrian(s) |
— |
— |
— |
— |
— |
0 |
0 |
0 |
0 |
0 |
0 |
0 |
Crashes involving bicyclist(s) |
— |
— |
— |
— |
— |
0 |
0 |
0 |
0 |
0 |
0 |
0 |
Total crashes |
0 |
0 |
1 |
1 |
0.3 |
0 |
1 |
0 |
4 |
0 |
4 |
1.6 |
1 Peak periods are defined as 7:00–10:00 AM and 3:30–6:30 PM. 2 The number of crashes in 2010 only includes crashes that occurred after construction was complete in summer 2010. 3 Represents total number of crashes in the after period. 4 Crashes in the after period are averaged across 2.58 years.
Source: Central Transportation Planning Staff.
TABLE 14
Crash Summary – King Street at Constitution Boulevard
Crash Category |
1997 |
1998 |
1999 |
Total |
Average |
2008 |
2009 |
20102 |
2011 |
2012 |
Total3 |
Average4 |
|---|---|---|---|---|---|---|---|---|---|---|---|---|
Crash severity |
N/A |
N/A |
N/A |
N/A |
N/A |
N/A |
N/A |
N/A |
N/A |
N/A |
N/A |
N/A |
Property damage only |
0 |
3 |
1 |
4 |
1.3 |
7 |
1 |
1 |
2 |
3 |
6 |
2.3 |
Personal injury |
0 |
2 |
0 |
2 |
0.7 |
0 |
2 |
1 |
2 |
0 |
3 |
1.2 |
Fatality |
0 |
0 |
0 |
0 |
0 |
0 |
0 |
0 |
0 |
0 |
0 |
0 |
Collision type |
N/A |
N/A |
N/A |
N/A |
N/A |
N/A |
N/A |
N/A |
N/A |
N/A |
N/A |
N/A |
Not reported |
0 |
1 |
0 |
1 |
0.3 |
0 |
0 |
0 |
0 |
0 |
0 |
0 |
Angle |
0 |
3 |
0 |
3 |
1 |
3 |
1 |
1 |
0 |
0 |
1 |
0.4 |
Rear-end |
0 |
1 |
1 |
2 |
0.7 |
1 |
2 |
1 |
4 |
2 |
7 |
2.7 |
Side-swipe |
— |
— |
— |
— |
— |
1 |
0 |
0 |
0 |
1 |
1 |
0.4 |
Head-on |
0 |
0 |
0 |
0 |
0 |
0 |
0 |
0 |
0 |
0 |
0 |
0 |
Single-vehicle |
— |
— |
— |
— |
— |
2 |
0 |
0 |
0 |
0 |
0 |
0 |
Roadway conditions |
— |
— |
— |
— |
— |
N/A |
N/A |
N/A |
N/A |
N/A |
N/A |
N/A |
Not reported |
— |
— |
— |
— |
— |
0 |
0 |
0 |
1 |
0 |
1 |
0.4 |
Wet or icy pavement |
— |
— |
— |
— |
— |
0 |
0 |
0 |
0 |
0 |
0 |
0 |
Weather conditions |
N/A |
N/A |
N/A |
N/A |
N/A |
N/A |
N/A |
N/A |
N/A |
N/A |
N/A |
N/A |
Dark/lighted |
— |
— |
— |
— |
— |
2 |
1 |
0 |
1 |
0 |
1 |
0.4 |
Clear |
— |
— |
— |
— |
— |
4 |
3 |
1 |
4 |
3 |
8 |
3.1 |
Cloudy |
— |
— |
— |
— |
— |
3 |
0 |
1 |
0 |
0 |
1 |
0.4 |
Rain |
— |
— |
— |
— |
— |
0 |
0 |
0 |
0 |
0 |
0 |
0 |
Snow |
— |
— |
— |
— |
— |
0 |
0 |
0 |
0 |
0 |
0 |
0 |
Crashes during weekday peak periods1 |
— |
— |
— |
— |
— |
2 |
0 |
0 |
1 |
1 |
2 |
0.8 |
Crashes involving pedestrian(s) |
— |
— |
— |
— |
— |
0 |
0 |
0 |
0 |
0 |
0 |
0 |
Crashes involving bicyclist(s) |
— |
— |
— |
— |
— |
0 |
0 |
0 |
0 |
0 |
0 |
0 |
Total crashes |
0 |
5 |
1 |
6 |
2 |
7 |
3 |
2 |
4 |
3 |
9 |
3.5 |
1 Peak periods are defined as 7:00–10:00 AM and 3:30–6:30 PM. 2 The number of crashes in 2010 only includes crashes that occurred after construction was complete in summer 2010. 3 Represents total number of crashes in the after period. 4 Crashes in the after period are averaged across 2.58 years.
Source: Central Transportation Planning Staff.
TABLE 15
Crash Summary – King Street at I-495 SB Ramps
Crash Category |
2008 |
2009 |
20102 |
2011 |
2012 |
Total3 |
Average4 |
|---|---|---|---|---|---|---|---|
Crash severity |
N/A |
N/A |
N/A |
N/A |
N/A |
N/A |
N/A |
Property damage only |
2 |
0 |
0 |
3 |
2 |
5 |
1.9 |
Personal injury |
0 |
0 |
0 |
1 |
0 |
1 |
0.4 |
Fatality |
0 |
0 |
0 |
0 |
0 |
0 |
0 |
Collision type |
N/A |
N/A |
N/A |
N/A |
N/A |
N/A |
N/A |
Not reported |
0 |
0 |
0 |
0 |
0 |
0 |
0 |
Angle |
0 |
0 |
0 |
2 |
2 |
4 |
1.6 |
Rear-end |
2 |
0 |
0 |
2 |
0 |
2 |
0.8 |
Side-swipe |
0 |
0 |
0 |
0 |
0 |
0 |
0 |
Head-on |
0 |
0 |
0 |
1 |
0 |
1 |
0.4 |
Single-vehicle |
0 |
0 |
0 |
0 |
0 |
0 |
0 |
Roadway conditions |
N/A |
N/A |
N/A |
N/A |
N/A |
N/A |
N/A |
Not reported |
0 |
0 |
0 |
4 |
0 |
4 |
1.6 |
Wet or icy pavement |
0 |
0 |
0 |
0 |
0 |
0 |
0 |
Weather conditions |
N/A |
N/A |
N/A |
N/A |
N/A |
N/A |
N/A |
Dark/lighted |
0 |
0 |
0 |
1 |
0 |
1 |
0.4 |
Clear |
2 |
0 |
0 |
4 |
2 |
6 |
2.3 |
Cloudy |
0 |
0 |
0 |
0 |
0 |
0 |
0 |
Rain |
0 |
0 |
0 |
1 |
0 |
1 |
0.4 |
Snow |
0 |
0 |
0 |
1 |
0 |
1 |
0.4 |
Crashes during weekday peak periods1 |
1 |
0 |
0 |
3 |
0 |
3 |
1.2 |
Crashes involving pedestrian(s) |
0 |
0 |
0 |
0 |
0 |
0 |
0 |
Crashes involving bicyclist(s) |
0 |
0 |
0 |
0 |
0 |
0 |
0 |
Total crashes |
2 |
0 |
0 |
5 |
2 |
7 |
2.7 |
1 Peak periods are defined as 7:00–10:00 AM and 3:30–6:30 PM.2 The number of crashes in 2010 only includes crashes that occurred after construction was complete in summer 2010.3 Represents total number of crashes in the after period. 4 Crashes in the after period are averaged across 2.58 years.
Source: Central Transportation Planning Staff.
TABLE 16
Crash Summary – King Street at I-495 NB Ramps
Crash Category |
2008 |
2009 |
20102 |
2011 |
2012 |
Total3 |
Average4 |
|---|---|---|---|---|---|---|---|
Crash severity |
N/A |
N/A |
N/A |
N/A |
N/A |
N/A |
N/A |
Property damage only |
1 |
2 |
1 |
6 |
4 |
11 |
4.3 |
Personal injury |
0 |
1 |
0 |
1 |
0 |
1 |
0.4 |
Fatality |
0 |
0 |
0 |
0 |
0 |
0 |
0 |
Collision type |
N/A |
N/A |
N/A |
N/A |
N/A |
N/A |
N/A |
Not reported |
0 |
0 |
0 |
0 |
0 |
0 |
0 |
Angle |
0 |
1 |
0 |
5 |
3 |
8 |
3.1 |
Rear-end |
1 |
2 |
0 |
2 |
1 |
3 |
1.2 |
Side-swipe |
0 |
0 |
0 |
0 |
0 |
0 |
0 |
Head-on |
0 |
0 |
0 |
0 |
0 |
0 |
0 |
Single-vehicle |
0 |
0 |
1 |
0 |
0 |
1 |
0.4 |
Roadway conditions |
N/A |
N/A |
N/A |
N/A |
N/A |
N/A |
N/A |
Not reported |
0 |
0 |
0 |
5 |
0 |
5 |
1.9 |
Wet or icy pavement |
1 |
1 |
0 |
0 |
2 |
2 |
0.8 |
Weather conditions |
N/A |
N/A |
N/A |
N/A |
N/A |
N/A |
N/A |
Dark/lighted |
0 |
0 |
0 |
1 |
3 |
4 |
1.6 |
Clear |
0 |
2 |
1 |
5 |
2 |
8 |
3.1 |
Cloudy |
1 |
1 |
0 |
2 |
1 |
3 |
1.2 |
Rain |
0 |
1 |
0 |
0 |
1 |
1 |
0.4 |
Snow |
1 |
0 |
0 |
0 |
0 |
0 |
0 |
Crashes during weekday peak periods1 |
0 |
1 |
0 |
3 |
3 |
6 |
2.3 |
Crashes involving pedestrian(s) |
0 |
0 |
0 |
0 |
0 |
0 |
0 |
Crashes involving bicyclist(s) |
0 |
0 |
0 |
0 |
0 |
0 |
0 |
Total crashes |
1 |
3 |
1 |
7 |
4 |
12 |
4.7 |
1 Peak periods are defined as 7:00–10:00 AM and 3:30–6:30 PM. 2 The number of crashes in 2010 only includes crashes that occurred after construction was complete in summer 2010. 3 Represents total number of crashes in the after period. 4 Crashes in the after period are averaged across 2.58 years.
Source: Central Transportation Planning Staff.
TABLE 17
Crash Summary – King Street at Union Street
Crash Category |
1997 |
1998 |
1999 |
Total |
Average |
2008 |
2009 |
20102 |
2011 |
2012 |
Total3 |
Average4 |
|---|---|---|---|---|---|---|---|---|---|---|---|---|
Crash severity |
N/A |
N/A |
N/A |
N/A |
N/A |
N/A |
N/A |
N/A |
N/A |
N/A |
N/A |
N/A |
Property damage only |
4 |
5 |
1 |
10 |
3.3 |
3 |
2 |
0 |
0 |
1 |
1 |
0.4 |
Personal injury |
6 |
3 |
1 |
10 |
3.3 |
0 |
1 |
0 |
1 |
0 |
1 |
0.4 |
Fatality |
0 |
0 |
0 |
0 |
0 |
0 |
0 |
0 |
0 |
0 |
0 |
0 |
Collision type |
|
|
|
|
|
|
|
|
|
|
|
|
Not reported |
0 |
0 |
0 |
0 |
0 |
0 |
0 |
0 |
0 |
0 |
0 |
0 |
Angle |
6 |
5 |
1 |
12 |
4 |
2 |
1 |
0 |
0 |
0 |
0 |
0 |
Rear-end |
2 |
3 |
1 |
6 |
2 |
1 |
1 |
0 |
1 |
1 |
2 |
0.8 |
Side-swipe |
-- |
-- |
-- |
-- |
-- |
0 |
0 |
0 |
0 |
0 |
0 |
0 |
Head-on |
2 |
0 |
0 |
2 |
0.7 |
0 |
1 |
0 |
0 |
0 |
0 |
0 |
Single-vehicle |
-- |
-- |
-- |
-- |
-- |
0 |
0 |
0 |
0 |
0 |
0 |
0 |
Roadway conditions |
N/A |
N/A |
N/A |
N/A |
N/A |
N/A |
N/A |
N/A |
N/A |
N/A |
N/A |
N/A |
Not reported |
-- |
-- |
-- |
-- |
-- |
0 |
0 |
0 |
0 |
0 |
0 |
0 |
Wet or icy pavement |
-- |
-- |
-- |
-- |
-- |
1 |
2 |
0 |
1 |
0 |
1 |
0.4 |
Weather conditions |
N/A |
N/A |
N/A |
N/A |
N/A |
N/A |
N/A |
N/A |
N/A |
N/A |
N/A |
N/A |
Dark/lighted |
-- |
-- |
-- |
-- |
-- |
1 |
1 |
0 |
0 |
0 |
0 |
0 |
Clear |
-- |
-- |
-- |
-- |
-- |
2 |
1 |
0 |
0 |
1 |
1 |
0.4 |
Cloudy |
-- |
-- |
-- |
-- |
-- |
1 |
2 |
0 |
1 |
0 |
1 |
0.4 |
Rain |
-- |
-- |
-- |
-- |
-- |
0 |
2 |
0 |
1 |
0 |
1 |
0.4 |
Snow |
-- |
-- |
-- |
-- |
-- |
0 |
0 |
0 |
0 |
0 |
0 |
0 |
Crashes during weekday peak periods1 |
-- |
-- |
-- |
-- |
-- |
2 |
1 |
0 |
1 |
0 |
1 |
0.4 |
Crashes involving pedestrian(s) |
-- |
-- |
-- |
-- |
-- |
0 |
0 |
0 |
0 |
0 |
0 |
0 |
Crashes involving bicyclist(s) |
-- |
-- |
-- |
-- |
-- |
0 |
0 |
0 |
0 |
0 |
0 |
0 |
Total crashes |
10 |
8 |
2 |
20 |
6.7 |
3 |
3 |
0 |
1 |
1 |
2 |
0.8 |
1 Peak periods are defined as 7:00–10:00 AM and 3:30–6:30 PM. 2 The number of crashes in 2010 only includes crashes that occurred after construction was complete in summer 2010. 3 Represents total number of crashes in the after period. 4 Crashes in the after period are averaged across 2.58 years.
Source: Central Transportation Planning Staff.
TABLE 18
Traffic Volume Comparison
Intersection of Constitution Boulevard (NB) at Upper Union Street (EB/WB)
N/A |
EB |
N/A |
WB |
N/A |
NB |
N/A |
N/A |
|---|---|---|---|---|---|---|---|
Scenario |
LT |
TH |
TH |
RT |
LT |
RT |
Total |
AM - 2000 (Before) |
45 |
260 |
295 |
40 |
85 |
75 |
2,520 |
AM - 2010 (Projected) |
56 |
267 |
302 |
82 |
87 |
77 |
2,922 |
AM - 2014 (After) |
20 |
257 |
370 |
115 |
141 |
91 |
2,667 |
PM - 2000 (Before) |
65 |
245 |
300 |
45 |
100 |
75 |
2,620 |
PM - 2010 (Projected) |
67 |
251 |
208 |
51 |
103 |
77 |
2,895 |
PM - 2014 (After) |
14 |
400 |
298 |
102 |
142 |
195 |
2,987 |
Intersection of King Street (EB/WB) at Constitution Boulevard (NB)
N/A |
EB |
N/A |
WB |
N/A |
NB |
N/A |
N/A |
|---|---|---|---|---|---|---|---|
Scenario |
TH |
RT |
LT |
TH |
LT |
RT |
Total |
AM - 2000 (Before) |
871 |
100 |
644 |
336 |
46 |
353 |
2,350 |
AM - 2010 (Projected) |
982 |
198 |
1,002 |
385 |
57 |
471 |
3,095 |
AM - 2014 (After) |
918 |
153 |
858 |
428 |
48 |
380 |
2,785 |
PM - 2000 (Before) |
682 |
36 |
371 |
858 |
104 |
583 |
2,634 |
PM - 2010 (Projected) |
764 |
45 |
474 |
942 |
183 |
940 |
3,348 |
PM - 2014 (After) |
421 |
36 |
327 |
970 |
168 |
873 |
2,795 |
Intersection of King Street (EB/WB) at I-495 SB Ramps (NB)
N/A |
EB |
N/A |
WB |
N/A |
SB |
N/A |
N/A |
|---|---|---|---|---|---|---|---|
Scenario |
TH |
RT |
LT |
TH |
LT |
RT |
Total |
AM - 2000 (Before) |
848 |
376 |
319 |
572 |
82 |
408 |
2,605 |
AM - 2010 (Projected) |
1,022 |
431 |
371 |
878 |
109 |
509 |
3,320 |
AM - 2014 (After) |
858 |
440 |
328 |
725 |
152 |
561 |
3,064 |
PM - 2000 (Before) |
885 |
380 |
292 |
758 |
245 |
471 |
3,031 |
PM - 2010 (Projected) |
1,223 |
481 |
334 |
892 |
285 |
524 |
3,739 |
PM - 2014 (After) |
891 |
403 |
282 |
801 |
382 |
496 |
3,255 |
Intersection of King Street (EB/WB) at I-495 NB Ramps
N/A |
EB |
N/A |
WB |
N/A |
NB |
N/A |
N/A |
|---|---|---|---|---|---|---|---|
Scenario |
LT |
TH |
TH |
RT |
LT |
RT |
Total |
AM - 2000 (Before) |
512 |
418 |
615 |
368 |
276 |
360 |
2,549 |
AM - 2010 (Projected) |
582 |
549 |
889 |
413 |
360 |
417 |
3,210 |
AM - 2014 (After) |
472 |
538 |
719 |
332 |
334 |
180 |
2,575 |
PM - 2000 (Before) |
434 |
696 |
817 |
190 |
233 |
409 |
2,779 |
PM - 2010 (Projected) |
508 |
1,000 |
964 |
223 |
262 |
466 |
3,423 |
PM - 2014 (After) |
529 |
744 |
703 |
232 |
380 |
326 |
2,914 |
Intersection of King Street (EB/WB) at Union Street (NB/SB)
N/A |
N/A |
EB |
N/A |
N/A |
WB |
N/A |
N/A |
NB |
N/A |
N/A |
SB |
N/A |
N/A |
|---|---|---|---|---|---|---|---|---|---|---|---|---|---|
Scenario |
LT |
TH |
RT |
LT |
TH |
RT |
LT |
TH |
RT |
LT |
TH |
RT |
Total |
AM - 2000 (Before) |
219 |
522 |
37 |
13 |
552 |
21 |
126 |
29 |
21 |
44 |
17 |
305 |
1,906 |
AM - 2010 (Projected) |
246 |
591 |
129 |
47 |
698 |
23 |
231 |
42 |
51 |
48 |
32 |
373 |
2,511 |
AM - 2014 (After) |
167 |
489 |
62 |
57 |
541 |
8 |
257 |
65 |
31 |
20 |
47 |
253 |
1,997 |
PM - 2000 (Before) |
291 |
707 |
107 |
33 |
577 |
30 |
186 |
30 |
32 |
57 |
35 |
244 |
2,329 |
PM - 2010 (Projected) |
371 |
902 |
193 |
57 |
647 |
33 |
266 |
42 |
59 |
63 |
47 |
274 |
2,954 |
PM - 2014 (After) |
263 |
723 |
84 |
50 |
560 |
45 |
179 |
38 |
39 |
39 |
38 |
196 |
2,254 |
Source: Central Transportation Planning Staff.
The 2000 before, 2010 projected, and 2014 after conditions were analyzed based on the turning-movement counts and signal timing data gathered by MPO staff. Tables 19-23 summarize the analysis for five study intersections.
The intersection of Upper Union Street at Constitution Boulevard was projected to operate at LOS A in the AM peak hour and LOS B in the PM peak hour. The intersection is currently operating at LOS B in the AM peak hour and LOS C in the PM peak hour. The FDR assumed this intersection would be converted to a fully actuated signalized intersection, but it remained unsignalized. However, the geometric modifications improved morning operations from LOS D to LOS B, and in the evening peak hour from LOS F to LOS D in the before conditions.
The intersection of King Street at Constitution Boulevard was projected to operate at LOS C in both the AM and PM peak hours. The intersection is currently operating at LOS D both the AM and PM peak hours. This is mostly because of high delays on the northbound Constitution Boulevard approach in the AM peak hour. Compared to the before conditions, widening King Street improved intersection operations in the AM peak hour from LOS F to LOS D and in the PM peak hour from LOS E to LOS D.
The intersection of King Street at the I-495 southbound ramps was projected to operate at LOS C in both the AM and PM peak hours, and the intersection currently is operating as expected. Widening King Street, combined with converting it to signalized control, greatly improved intersection operations in both the AM and PM peak hours.
The intersection of King Street at the I-495 northbound ramps was projected to operate at LOS E in the AM peak hour and LOS C in the PM peak hour. Although the intersection is operating as projected in the AM peak hour, it is operating at LOS E in the PM peak hour. Widening and converting the signal at King Street and the I-495 northbound ramps improved intersection operations LOS F to LOS E in both peak hours compared to the unsignalized conditions before reconstruction.
The intersection of King Street at Union Street was projected to operate at LOS D in the AM and PM peak hours; the intersection currently is operating as projected, although high delays are experienced on the eastbound and westbound King Street approaches.
TABLE 19
LOS Comparison – Intersection of Constitution Boulevard at Upper Union Street
N/A |
N/A |
N/A |
Before1 |
N/A |
N/A |
Projected2 |
N/A |
N/A |
After3 |
N/A |
|---|---|---|---|---|---|---|---|---|---|---|
Intersection / Approach6 |
Movement |
LOS |
Delay4 |
95% Q5 |
LOS |
Delay |
95% Q |
LOS |
Delay |
95% Q |
AM Peak Period |
N/A |
N/A |
N/A |
N/A |
N/A |
N/A |
N/A |
N/A |
N/A |
N/A |
Constitution Blvd. – EB |
LR (L) |
D |
27.1 |
105 |
D |
40.4 |
115 |
A |
7.9 |
8 |
Constitution Blvd. – EB |
(T) |
— |
— |
— |
— |
— |
— |
— |
— |
— |
Upper Union St. – NB |
TL |
A |
0.5 |
1 |
A |
4.6 |
41 |
B |
10.8 |
41 |
Upper Union St. – SB |
TR1 (T) |
— |
— |
— |
— |
— |
— |
— |
— |
— |
Upper Union St. – SB |
(R) |
— |
— |
— |
— |
— |
— |
— |
— |
— |
Overall |
— |
— |
— |
— |
A |
8.0 |
— |
— |
— |
— |
PM Peak Period |
N/A |
N/A |
N/A |
N/A |
N/A |
N/A |
N/A |
N/A |
N/A |
N/A |
Constitution Blvd. – EB |
LR |
F |
90.1 |
455 |
A |
9.0 |
139 |
D |
30.8 |
131 |
Constitution Blvd. – EB |
(T) |
— |
— |
— |
— |
— |
— |
— |
— |
— |
Upper Union St. – NB |
TL |
A |
0.1 |
0 |
D |
36.6 |
180 |
C |
19.4 |
39 |
Upper Union St. – SB |
TR1 (T) |
— |
— |
— |
B |
11.6 |
m179 |
— |
— |
— |
Upper Union St. – SB |
(R) |
— |
— |
— |
— |
— |
m0 |
— |
— |
— |
Overall |
— |
— |
— |
— |
B |
18.1 |
-- |
— |
— |
— |
1 2000 “before” existing traffic volumes from FDR. 2 2010 “projected” future traffic volumes with build conditions from FDR. 3 2014 “after” existing traffic volumes. 4 Delay is measured in seconds. 5 Queue length is measured in feet. 6 Constitution Boulevard runs north/south and Upper Union Street runs east/west in the after conditions.
Notes: (x) Turning lane configuration in Projected/After conditions. m = Volume for 95th percentile queue is metered by upstream signal.
Source: Central Transportation Planning Staff.
TABLE 20
LOS Comparison – Intersection of King Street at Constitution Boulevard
N/A |
N/A |
N/A |
Before1 |
N/A |
N/A |
Projected2 |
N/A |
N/A |
After3 |
N/A |
|---|---|---|---|---|---|---|---|---|---|---|
Intersection / Approach6 |
Movement |
LOS |
Delay4 |
95% Q5 |
LOS |
Delay |
95% Q |
LOS |
Delay |
95% Q |
AM Peak Period |
N/A |
N/A |
N/A |
N/A |
N/A |
N/A |
N/A |
N/A |
N/A |
N/A |
King St. – EB |
T (TR) |
F |
196.9 |
#1061 |
D |
43.1 |
#496 |
D |
49.1 |
#474 |
King St. – EB |
R |
A |
9.4 |
51 |
— |
— |
— |
— |
— |
— |
King St. – WB |
L |
F |
212.2 |
#729 |
D |
36.9 |
#422 |
D |
46.3 |
m329 |
King St. – WB |
T |
A |
4.3 |
83 |
A |
2.2 |
m52 |
A |
1.9 |
m39 |
Upper Union St. – NB |
L |
D |
42.5 |
63 |
F |
92.5 |
#99 |
F |
188.2 |
#85 |
Upper Union St. – NB |
R |
B |
18.6 |
211 |
B |
10.4 |
148 |
B |
16.2 |
121 |
Overall |
— |
F |
132.1 |
— |
C |
31.9 |
— |
D |
40.3 |
— |
PM Peak Period |
N/A |
N/A |
N/A |
N/A |
N/A |
N/A |
N/A |
N/A |
N/A |
N/A |
King St. – EB |
T (TR) |
F |
159.0 |
#776 |
C |
30.8 |
277 |
C |
22.3 |
154 |
King St. – EB |
R |
A |
9.9 |
23 |
— |
— |
— |
— |
— |
— |
King St. – WB |
L |
C |
26.8 |
291 |
D |
43.3 |
m152 |
C |
34.0 |
m134 |
King St. – WB |
T |
A |
8.5 |
358 |
D |
36.7 |
m450 |
E |
73.9 |
m572 |
Upper Union St. – NB |
L |
D |
53.3 |
120 |
C |
24.9 |
157 |
D |
35.9 |
150 |
Upper Union St. – NB |
R |
E |
65.8 |
447 |
B |
17.5 |
363 |
C |
34.3 |
299 |
Overall |
— |
E |
67.7 |
— |
C |
30.2 |
— |
D |
44.3 |
— |
1 2000 “before” existing traffic volumes from FDR. 2 2010 “projected” future traffic volumes with build conditions from FDR. 3 2014 “after” existing traffic volumes. 4 Delay is measured in seconds. 5 Queue length is measured in feet. 6 This intersection is signed as King Street at Constitution Boulevard in after conditions
Notes: (x) Turning lane configuration in Projected/After conditions. # = 95th percentile volume exceeds capacity; queues may be longer. m = Volume for 95th percentile queue is metered by upstream signal.
Source: Central Transportation Planning Staff.
TABLE 21
LOS Comparison – Intersection of King Street at I-495 SB Ramps
N/A |
N/A |
N/A |
Before1 |
N/A |
N/A |
Projected2 |
N/A |
N/A |
After3 |
N/A |
|---|---|---|---|---|---|---|---|---|---|---|
Intersection / Approach |
Movement |
LOS |
Delay4 |
95% Q5 |
LOS |
Delay |
95% Q |
LOS |
Delay |
95% Q |
AM Peak Period |
N/A |
N/A |
N/A |
N/A |
N/A |
N/A |
N/A |
N/A |
N/A |
N/A |
King St. – EB |
TR (T) |
— |
— |
— |
D |
49.8 |
m#399 |
D |
44.3 |
m333 |
King St. – EB |
(R) |
— |
— |
— |
A |
0.3 |
m0 |
A |
0.6 |
0 |
King St. – WB |
L |
C |
17.6 |
85 |
— |
— |
— |
— |
— |
— |
King St. – WB |
T (TL) |
— |
— |
— |
A |
5.3 |
m46 |
B |
12.6 |
m88 |
I-495 SB Off-Ramp |
L |
F |
* |
* |
D |
37.7 |
101 |
C |
32.1 |
138 |
I-495 SB Off-Ramp |
R |
F |
* |
* |
C |
25.6 |
122 |
F |
83.8 |
#331 |
Overall |
— |
— |
— |
— |
C |
22.5 |
— |
C |
32.3 |
— |
PM Peak Period |
N/A |
N/A |
N/A |
N/A |
N/A |
N/A |
N/A |
N/A |
N/A |
N/A |
King St. – EB |
TR (T) |
— |
— |
— |
B |
15.1 |
292 |
B |
16.8 |
m288 |
King St. – EB |
(R) |
— |
— |
— |
A |
0.4 |
0 |
A |
0.4 |
0 |
King St. – WB |
L |
C |
17.7 |
78 |
— |
— |
— |
— |
— |
— |
King St. – WB |
T (TL) |
— |
— |
— |
C |
29.3 |
m#171 |
C |
32.4 |
m92 |
I-495 SB Off-Ramp |
L |
F |
* |
* |
D |
49.3 |
245 |
E |
70.7 |
#422 |
I-495 SB Off-Ramp |
R |
F |
* |
* |
B |
19.3 |
126 |
E |
57.2 |
#280 |
Overall |
— |
— |
— |
— |
C |
21.1 |
— |
C |
30.9 |
— |
1 2000 “before” existing traffic volumes from FDR. 2 2010 “projected” future traffic volumes with build conditions from FDR. 3 2014 “after” existing traffic volumes. 4 Delay is measured in seconds. 5 Queue length is measured in feet.
Notes: (x) Turning lane configuration in Projected/After conditions. # = 95th percentile volume exceeds capacity; queues may be longer. m = Volume for 95th percentile queue is metered by upstream signal, * = Volume greatly exceeds capacity, the methods could not compute delay or queue length.
Source: Central Transportation Planning Staff.
TABLE 22
LOS Comparison – Intersection of King Street at I-495 NB Ramps
N/A |
N/A |
N/A |
Before1 |
N/A |
N/A |
Projected2 |
N/A |
N/A |
After3 |
N/A |
|---|---|---|---|---|---|---|---|---|---|---|
Intersection / Approach |
Movement |
LOS |
Delay4 |
95% Q5 |
LOS |
Delay |
95% Q |
LOS |
Delay |
95% Q |
AM Peak Period |
N/A |
N/A |
N/A |
N/A |
N/A |
N/A |
N/A |
N/A |
N/A |
N/A |
King St. – EB |
L |
C |
16.4 |
120 |
D |
43.0 |
m#370 |
B |
16.2 |
m20 |
King St. – EB |
T |
— |
— |
— |
A |
4.6 |
m0 |
A |
3.3 |
m0 |
King St. – WB |
TR |
— |
— |
— |
E |
56.5 |
m#465 |
D |
35.7 |
m381 |
I-495 NB Off-Ramp |
L |
F |
* |
* |
F |
217.1 |
#237 |
F |
370.9 |
#218 |
I-495 NB Off-Ramp |
R |
F |
* |
* |
A |
0.4 |
0 |
A |
0.2 |
0 |
Overall |
— |
— |
— |
— |
E |
55.9 |
— |
E |
78.9 |
— |
PM Peak Period |
N/A |
N/A |
N/A |
N/A |
N/A |
N/A |
N/A |
N/A |
N/A |
N/A |
King St. – EB |
L |
C |
24.5 |
160 |
C |
25.5 |
#414 |
D |
47.2 |
m#417 |
King St. – EB |
T |
— |
— |
— |
C |
21.2 |
726 |
B |
10.5 |
m409 |
King St. – WB |
TR |
— |
— |
— |
C |
25.9 |
m196 |
B |
15.9 |
m131 |
I-495 NB Off-Ramp |
L |
F |
* |
* |
F |
134.3 |
#173 |
F |
323.5 |
#267 |
I-495 NB Off-Ramp |
R |
F |
* |
* |
A |
0.4 |
0 |
A |
0.3 |
0 |
Overall |
— |
— |
— |
— |
C |
29.3 |
— |
E |
58.1 |
— |
1 2000 “before” existing traffic volumes from FDR. 2 2010 “projected” future traffic volumes with build conditions from FDR. 3 2014 “after” existing traffic volumes. 4 Delay is measured in seconds. 5 Queue length is measured in feet.
Notes: * = Volume greatly exceeds capacity, the methods could not compute delay or queue length. (x) Turning lane configuration in Projected/After conditions. m = Volume for 95th percentile queue is metered by upstream signal. # = 95th percentile volume exceeds capacity; queues may be longer.
Source: Central Transportation Planning Staff.
TABLE 23
LOS Comparison – Intersection of King Street at Union Street
N/A |
N/A |
N/A |
Before1 |
N/A |
N/A |
Projected2 |
N/A |
N/A |
After3 |
N/A |
|---|---|---|---|---|---|---|---|---|---|---|
Intersection / Approach |
Movement |
LOS |
Delay4 |
95% Q5 |
LOS |
Delay |
95% Q |
LOS |
Delay |
95% Q |
AM Peak Period |
N/A |
N/A |
N/A |
N/A |
N/A |
N/A |
N/A |
N/A |
N/A |
N/A |
Union St. – SB |
L |
D |
46.9 |
220 |
D |
52.3 |
#389 |
C |
21.9 |
146 |
Union St. – SB |
TR (T) |
B |
15.3 |
417 |
C |
29.9 |
663 |
B |
19.3 |
382 |
Union St. – SB |
(R) |
— |
— |
— |
A |
1.7 |
26 |
A |
4.9 |
26 |
Union St. – NB |
L |
D |
47.8 |
30 |
— |
— |
— |
— |
— |
— |
Union St. – NB |
TR (LTR) |
D |
44.9 |
#691 |
E |
56.3 |
#351 |
D |
44.3 |
#278 |
King St. – EB |
L |
D |
37.6 |
135 |
F |
130.9 |
#292 |
F |
117.8 |
#292 |
King St. – EB |
TR |
B |
19.6 |
49 |
B |
15.1 |
62 |
C |
23.3 |
82 |
King St. – WB |
TL |
D |
52.1 |
83 |
F |
203.6 |
#188 |
F |
117.1 |
#112 |
King St. –WB |
R |
B |
13.0 |
132 |
B |
18.0 |
162 |
C |
21.3 |
#86 |
Overall |
— |
C |
30.1 |
— |
D |
51.4 |
— |
D |
43.5 |
— |
PM Peak Period |
N/A |
N/A |
N/A |
N/A |
N/A |
N/A |
N/A |
N/A |
N/A |
N/A |
Union St. – SB |
L |
D |
53.3 |
305 |
E |
57.0 |
m#376 |
D |
41.3 |
204 |
Union St. – SB |
TR (T) |
C |
32.2 |
#867 |
B |
13.5 |
#542 |
A |
9.6 |
141 |
Union St. – SB |
(R) |
— |
— |
— |
A |
0.3 |
m0 |
A |
0.7 |
m2 |
Union St. – NB |
L |
D |
52.1 |
57 |
— |
— |
— |
— |
— |
— |
Union St. – NB |
TR (LTR) |
F |
92.0 |
#790 |
E |
58.8 |
#354 |
E |
66.9 |
#352 |
King St. – EB |
L |
D |
42.3 |
184 |
F |
139.4 |
#295 |
E |
66.0 |
#166 |
King St. – EB |
TR |
B |
18.2 |
52 |
B |
15.0 |
62 |
B |
14.9 |
58 |
King St. – WB |
TL |
E |
67.8 |
120 |
F |
218.8 |
#189 |
F |
122.2 |
#144 |
King St. –WB |
R |
B |
15.9 |
121 |
B |
17.9 |
162 |
C |
20.8 |
#85 |
Overall |
— |
D |
50.1 |
— |
D |
48.8 |
— |
D |
39.2 |
— |
1 2000 “before” existing traffic volumes from FDR. 2 2010 “projected” future traffic volumes with build conditions from FDR. 3 2014 “after” existing traffic volumes. 4 Delay is measured in seconds. 5 Queue length is measured in feet.
Notes: (x) Turning lane configuration in Projected/After conditions. # = 95th percentile volume exceeds capacity, queues may be longer. m = Volume for 95th percentile queue is metered by upstream signal.
Source: Central Transportation Planning Staff.
The intersection of Route 53 at Old Washington Street is currently a four-way intersection, with Route 53 running north south and Old Washington/Pond Street running east west. Prior to reconstruction, Pond Street intersected Route 53 from the east approximately 100 feet south of Old Washington Street. However, it was realigned to intersect with Route 53 at Old Washington Street as part of this TIP project. Widening Route 53 from four to five lanes was included in the reconstruction, with two travel lanes in each direction and a two-way left-turn lane. The surrounding land use is a mixture of retail and commercial, but homes also exist along Old Washington Street. Figure 16 illustrates the study area..
The following sections provide a summary of the before-and-after conditions, along with a comparison of the crash data, traffic volumes, and traffic analysis.
Route 53 and Old Washington Street formed a three-way intersection controlled by a semi-actuated traffic signal. Northbound Route 53 consisted of two multi-purpose lanes, and southbound Route 53 consisted of two through lanes and one exclusive right-turn lane onto Old Washington Street. Old Washington Street consisted of a single multi-purpose lane that operated as one short left-turn lane and one exclusive right-turn lane. No bicycle or pedestrian facilities existed at this intersection. As previously mentioned, Route 53 intersected with Pond Street approximately 100 feet south of Old Washington Street and was controlled by a stop sign.
The crash rate before the intersection reconstruction was 0.38 crashes per million entering vehicles, which was below the District 6 average of 0.77 crashes per million entering vehicles for signalized intersections. The intersection operated at an acceptable LOS of B in both the morning and evening peak hours. It was necessary to reconstruct this intersection to accommodate future traffic growth along Route 53 and Old Washington Street and to provide safe and efficient traffic operations.
The reconstruction at Route 53 at Old Washington Street included widening and restriping the north- and southbound Route 53 approaches to maintain a five-lane cross section. The new lane configuration provides one exclusive left-turn lane, one through lane, and one through-right lane. Pond Street was realigned to form a four-way intersection with Old Washington Street and Route 53, as illustrated in Figure 17. Sidewalks on the south side of route 53 were constructed, and wheelchair ramps were installed to meet current Americans with Disabilities Act of 1990 (ADA) and MassDOT standards. In addition, a shared shoulder for bicycles was installed on all approaches with bicycle detection.
Traffic control at this intersection was upgraded to accommodate projected traffic growth near Route 53. A fully actuated traffic signal was installed with optimal signal timings selected for peak hour traffic demand. An exclusive pushbutton-activated pedestrian phase was provided on the eastbound Old Washington Street approach. Existing signs and pavement markings were upgraded to match the updated intersection lane configurations.
The crash rate for the years 2008 to 2012 is 0.13 crashes per million entering vehicles, which is well below the current MassDOT District 6 average rate of 0.76 crashes per million entering vehicles at signalized intersections. Analysis of the after conditions matches the projected conditions discussed in the FDR. The intersection currently operates at LOS B in the AM peak hour and LOS C in the PM peak hour. Analysis shows that the modified geometry and traffic signal upgrades improved both safety and operations at this intersection.
FIGURE 16
Hanover Study Area
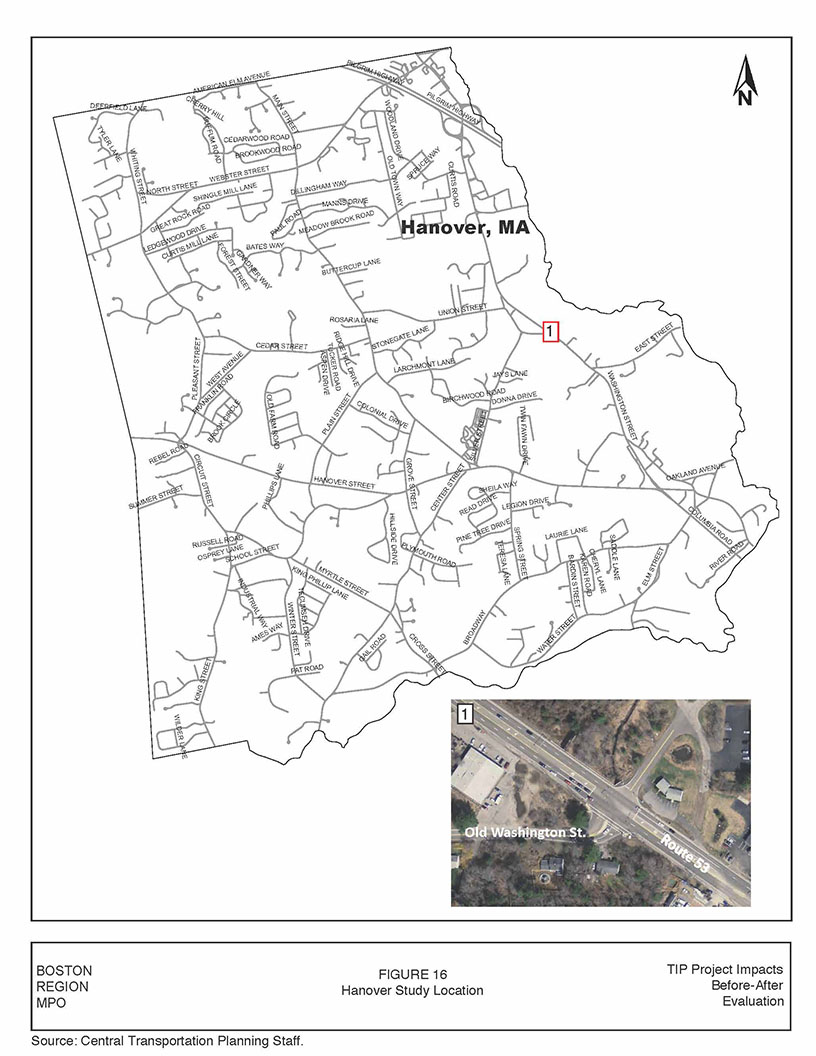
FIGURE 17
Before-and-After Reconstruction of Route 53 at Old Washington/Pond Street
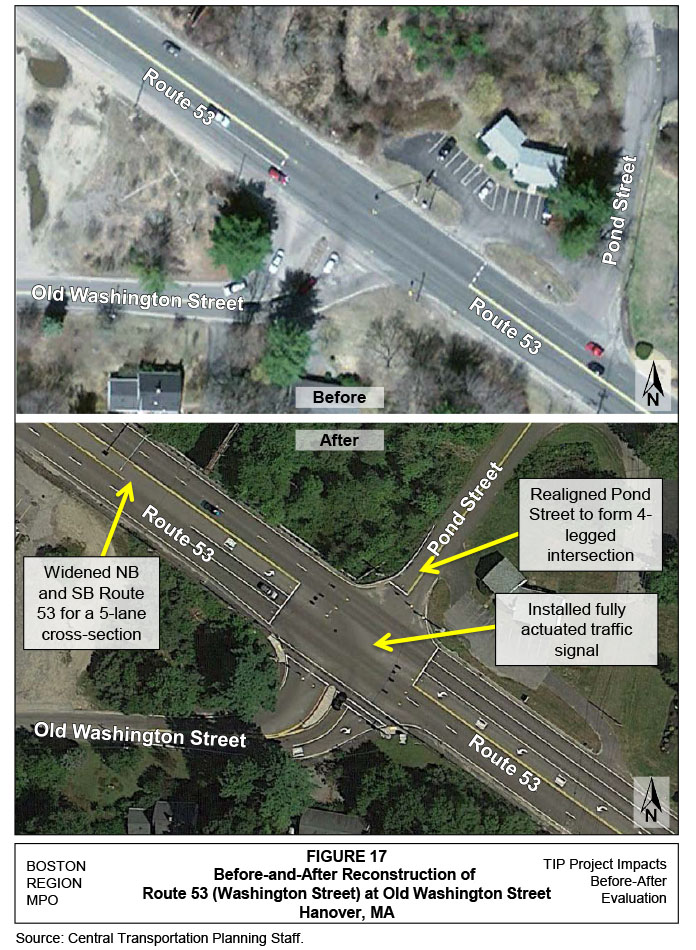
Crash data from the Hanover FDR (2001-03) were compared to current MassDOT RMV data for the most recent available five-year period, from 2008 to 2012. Table 24 provides a summary of crashes at Route 53 at Old Washington Street. A collision diagram based on the after-period data is located in Appendix C.
Only one crash occurred at the intersection of Route 53 at Old Washington Street between 2001 and 2003, with an average of 0.3 crashes per year. There were three crashes during the after period, averaging 1.3 crashes per year. The total and average number of crashes in the after period includes crashes that occurred after construction was complete in 2010. The crash rate of 0.13 crashes per million vehicles is less than the District 6 average for signalized intersections.
Since the Route 53 corridor was widened to a five-lane cross section as part of this project, crash data also were collected along Route 53 from Mill Street to Old Washington/Pond Street. Table 5 summarizes the frequency and type of crashes along Route 53 within the project limits. Forty-one crashes occurred between 2001 and 2003, with an average of 11.7 crashes per year, the majority of which were rear-end and sideswipe crashes. Thirty-one crashes occurred between 2010 and 2012, with an average of 13.3 crashes per year. The number of angle crashes increased in the after period, with 6.4 angle crashes per year. Although the crash modification factors (CMF) from previous studies show that adding a two-way left-turn lane may reduce crashes, crashes along Route 53 increased in the after period compared to the before period.
MPO staff collected turning-movement counts at the intersection of Route 53 at Old Washington Street on June 26, 2014 while school was still in session. Data were recorded in 15-minute intervals for the morning peak period from 7:00 to 9:00 AM, and the evening peak period from 4:00 to 6:00 PM. Traffic count summaries are located in Appendix A. Table 26 compares the traffic volumes for three separate years for each intersection, represented by the following scenarios:
TABLE 24
Crash Summary – Route 53 at Old Washington/Pond Street
Crash Category |
2001 |
2002 |
2003 |
Total |
Average |
2008 |
2009 |
20102 |
2011 |
2012 |
Total3 |
Average4 |
|---|---|---|---|---|---|---|---|---|---|---|---|---|
Crash severity |
N/A |
N/A |
N/A |
N/A |
N/A |
N/A |
N/A |
N/A |
N/A |
|
Blank |
Blank |
Property damage only |
0 |
0 |
0 |
0 |
0 |
0 |
1 |
0 |
3 |
0 |
3 |
1.3 |
Personal injury |
0 |
0 |
1 |
1 |
0.3 |
0 |
0 |
0 |
0 |
0 |
0 |
0 |
Fatality |
0 |
0 |
0 |
0 |
0 |
0 |
0 |
0 |
0 |
0 |
0 |
0 |
Collision type |
N/A |
N/A |
N/A |
N/A |
N/A |
N/A |
N/A |
N/A |
N/A |
0 |
|
|
Not reported |
0 |
0 |
0 |
0 |
0 |
0 |
0 |
0 |
0 |
0 |
0 |
0 |
Angle |
0 |
0 |
0 |
0 |
0 |
0 |
0 |
0 |
2 |
0 |
2 |
0.9 |
Rear-end |
0 |
0 |
1 |
1 |
0.3 |
0 |
1 |
0 |
1 |
0 |
1 |
0.4 |
Side-swipe |
— |
0 |
0 |
0 |
0 |
0 |
0 |
0 |
0 |
0 |
0 |
0 |
Head-on |
0 |
0 |
0 |
0 |
0 |
0 |
0 |
0 |
0 |
0 |
0 |
0 |
Single-vehicle |
— |
0 |
0 |
0 |
0 |
0 |
0 |
0 |
0 |
0 |
0 |
0 |
Roadway conditions |
N/A |
N/A |
N/A |
N/A |
N/A |
N/A |
N/A |
N/A |
N/A |
|
|
|
Not reported |
0 |
0 |
0 |
0 |
0 |
0 |
0 |
0 |
0 |
0 |
0 |
0 |
Wet or icy pavement |
0 |
0 |
0 |
0 |
0 |
0 |
0 |
0 |
2 |
0 |
2 |
0.9 |
Weather conditions |
N/A |
N/A |
N/A |
N/A |
N/A |
N/A |
N/A |
N/A |
N/A |
|
|
|
Dark/lighted |
0 |
0 |
0 |
0 |
0 |
0 |
1 |
0 |
0 |
0 |
0 |
0 |
Clear |
0 |
0 |
1 |
1 |
0.3 |
0 |
1 |
0 |
2 |
0 |
2 |
0.9 |
Cloudy |
0 |
0 |
0 |
0 |
0 |
0 |
0 |
0 |
1 |
0 |
1 |
0.4 |
Rain |
0 |
0 |
0 |
0 |
0 |
0 |
0 |
0 |
0 |
0 |
0 |
0 |
Snow |
0 |
0 |
0 |
0 |
0 |
0 |
0 |
0 |
0 |
0 |
0 |
0 |
Crashes during weekday peak periods1 |
0 |
0 |
0 |
0 |
0 |
0 |
0 |
0 |
1 |
0 |
1 |
0.4 |
Crashes involving pedestrian(s) |
0 |
0 |
1 |
1 |
0.3 |
0 |
0 |
0 |
0 |
0 |
0 |
0 |
Crashes involving bicyclist(s) |
0 |
0 |
0 |
0 |
0 |
0 |
0 |
0 |
0 |
0 |
0 |
0 |
Total crashes |
0 |
0 |
1 |
1 |
0.3 |
0 |
1 |
0 |
3 |
0 |
3 |
1.3 |
1 Peak periods are defined as 7:00–10:00 AM and 3:30–6:30 PM. 2 The number of crashes in 2010 only includes crashes that occurred after construction was complete in autumn 2010. 3 Represents total number of crashes in the after period. 4 Crashes in the after period are averaged across 2.33 years.
Source: Central Transportation Planning Staff.
TABLE 25
Crash Summary – Route 53 between Mill Street and Pond Street
Crash Category |
2001 |
2002 |
2003 |
Total |
Average |
2008 |
2009 |
20102 |
2011 |
2012 |
Total3 |
Average4 |
|---|---|---|---|---|---|---|---|---|---|---|---|---|
Crash severity |
N/A |
N/A |
N/A |
N/A |
N/A |
N/A |
N/A |
N/A |
N/A |
|
Blank |
Blank |
Property damage only |
12 |
6 |
14 |
32 |
10.7 |
7 |
21 |
2 |
12 |
7 |
21 |
9.0 |
Personal injury |
2 |
6 |
4 |
12 |
4 |
8 |
4 |
3 |
3 |
4 |
10 |
4.3 |
Fatality |
0 |
0 |
0 |
0 |
0 |
0 |
0 |
0 |
0 |
0 |
0 |
0 |
Collision type |
|
|
|
|
|
|
|
|
|
|
|
|
Not reported |
3 |
0 |
4 |
7 |
2.3 |
0 |
0 |
0 |
0 |
0 |
0 |
0 |
Angle |
3 |
4 |
10 |
17 |
5.7 |
3 |
10 |
3 |
6 |
6 |
15 |
6.4 |
Rear-end |
7 |
8 |
1 |
16 |
5.3 |
12 |
12 |
2 |
4 |
4 |
10 |
4.3 |
Side-swipe |
-- |
2 |
1 |
3 |
1 |
0 |
4 |
0 |
1 |
1 |
2 |
0.9 |
Head-on |
1 |
1 |
0 |
2 |
0.7 |
0 |
0 |
0 |
1 |
0 |
1 |
0.4 |
Single-vehicle |
-- |
0 |
1 |
1 |
0.3 |
0 |
0 |
0 |
1 |
0 |
1 |
0.4 |
Roadway conditions |
|
|
|
|
|
|
|
|
|
|
|
|
Not reported |
1 |
0 |
1 |
2 |
0.7 |
0 |
0 |
0 |
0 |
0 |
0 |
0 |
Wet or icy pavement |
4 |
5 |
6 |
15 |
5 |
3 |
5 |
1 |
5 |
2 |
8 |
3.4 |
Weather conditions |
|
|
|
|
|
|
|
|
|
|
|
|
Dark/lighted |
3 |
1 |
1 |
5 |
1.7 |
2 |
5 |
2 |
2 |
2 |
6 |
2.6 |
Clear |
8 |
10 |
11 |
29 |
9.7 |
10 |
17 |
4 |
8 |
9 |
21 |
9 |
Cloudy |
1 |
3 |
4 |
8 |
2.7 |
3 |
5 |
1 |
4 |
0 |
5 |
2.1 |
Rain |
3 |
2 |
4 |
9 |
3 |
1 |
4 |
0 |
2 |
2 |
4 |
1.7 |
Snow |
0 |
0 |
2 |
2 |
0.7 |
2 |
0 |
0 |
1 |
0 |
1 |
0.4 |
Crashes during weekday peak periods1 |
2 |
2 |
4 |
8 |
2.7 |
5 |
5 |
2 |
4 |
3 |
9 |
3.9 |
Crashes involving pedestrian(s) |
2 |
0 |
0 |
0 |
0 |
0 |
0 |
0 |
0 |
0 |
0 |
0 |
Crashes involving bicyclist(s) |
0 |
0 |
0 |
0 |
0 |
0 |
0 |
0 |
0 |
0 |
0 |
0 |
Total crashes |
14 |
15 |
22 |
41 |
11.7 |
15 |
26 |
5 |
15 |
11 |
31 |
13.3 |
1 Peak periods are defined as 7:00–10:00 AM and 3:30–6:30 PM. 2 The number of crashes in 2010 only includes crashes that occurred after construction was complete in autumn 2010. 3 Represents the total number of crashes in the after period. 4 The crashes in the after period are averaged across 2.33 years.
Source: Central Transportation Planning Staff.
As shown in Table 26, overall traffic volumes remained similar between 1997 and 2014. Traffic volumes did not grow as predicted in the AM peak hour, but the PM peak hour volumes grew as predicted. In general, volumes remained relatively the same from 2005 to 2014, with individual increases and decreases in some turning movements. Overall traffic volumes decreased by 10% in the AM peak hour and increased by 6% in the PM peak hour.
TABLE 26
Traffic Volume Comparison
Intersection of Route 53 (NB/SB) at Old Washington/Pond Street (EB/WB)
N/A |
N/A |
EB |
N/A |
N/A |
WB |
N/A |
N/A |
NB |
N/A |
N/A |
SB |
N/A |
N/A |
|---|---|---|---|---|---|---|---|---|---|---|---|---|---|
Scenario |
LT |
TH |
RT |
LT |
TH |
RT |
LT |
TH |
RT |
LT |
TH |
RT |
Total |
AM - 2005 (Before) |
258 |
— |
105 |
— |
— |
— |
61 |
795 |
— |
— |
442 |
77 |
1,738 |
AM - 2015 (Projected) |
271 |
5 |
110 |
5 |
5 |
5 |
64 |
836 |
5 |
81 |
465 |
81 |
1,933 |
AM - 2014 (After) |
223 |
6 |
51 |
5 |
4 |
1 |
32 |
741 |
1 |
2 |
399 |
98 |
1,563 |
PM - 2005 (Before) |
185 |
— |
90 |
— |
— |
— |
92 |
651 |
— |
— |
1042 |
250 |
2,310 |
PM - 2015 (Projected) |
194 |
5 |
95 |
5 |
5 |
5 |
97 |
684 |
5 |
5 |
1095 |
263 |
2,458 |
PM - 2014 (After) |
236 |
— |
85 |
1 |
— |
— |
65 |
608 |
1 |
— |
1127 |
342 |
2,465 |
Source: Central Transportation Planning Staff.
Staff analyzed the 2005 before, 2015 projected, and 2014 after conditions based on the turning-movement counts and signal timing data. Table 27 summarizes the results for Route 53 at Old Washington Street.
The intersection was projected to operate at LOS B in the AM peak hour and LOS C in the PM peak hour. The intersection currently is operating as projected in the FDR. All approaches along this intersection operate at acceptable levels of service.
TABLE 27
LOS Comparison – Intersection of Route 53 at Old Washington/Pond Street
N/A |
N/A |
N/A |
Before1 |
N/A |
N/A |
Projected2 |
N/A |
N/A |
After3 |
N/A |
|---|---|---|---|---|---|---|---|---|---|---|
Intersection / Approach |
Movement |
LOS |
Delay4 |
95% Q5 |
LOS |
Delay |
95% Q |
LOS |
Delay |
95% Q |
AM Peak Period |
N/A |
N/A |
N/A |
N/A |
N/A |
N/A |
N/A |
N/A |
N/A |
N/A |
Old Washington St. – EB |
L (TL) |
C |
30.9 |
168 |
C |
33.5 |
#206 |
D |
35.5 |
83 |
Old Washington St. – EB |
R |
A |
5.6 |
31 |
A |
5.4 |
31 |
A |
2.6 |
4 |
Pond St. – WB |
(LTR) |
— |
— |
— |
B |
12.9 |
14 |
B |
13.2 |
10 |
Rte. 53 – NB |
LT (L) |
B |
11.4 |
202 |
A |
8.2 |
28 |
A |
8.0 |
15 |
Rte. 53 – NB |
(TR) |
— |
— |
— |
B |
14.7 |
#234 |
B |
13.7 |
185 |
Rte. 53 – SB |
(L) |
— |
— |
— |
A |
7.4 |
5 |
A |
7.5 |
2 |
Rte. 53 – SB |
T (TR) |
A |
8.6 |
88 |
B |
15.0 |
125 |
B |
15.3 |
113 |
Rte. 53 – SB |
R |
A |
2.8 |
19 |
— |
— |
— |
— |
— |
— |
Overall |
— |
B |
12.9 |
— |
B |
16.8 |
— |
B |
16.9 |
— |
PM Peak Period |
N/A |
N/A |
N/A |
N/A |
N/A |
N/A |
N/A |
N/A |
N/A |
N/A |
Old Washington St. – EB |
L (TL) |
C |
29.0 |
123 |
D |
36.8 |
#159 |
D |
35.3 |
#170 |
Old Washington St. – EB |
R |
B |
13.1 |
47 |
A |
6.9 |
33 |
B |
10.5 |
41 |
Pond St. – WB |
(LTR) |
— |
— |
— |
B |
16.2 |
16 |
B |
18.0 |
8 |
Rte. 53 – NB |
LT (L) |
B |
10.4 |
163 |
B |
10.1 |
36 |
A |
8.4 |
24 |
Rte. 53 – NB |
(TR) |
— |
— |
— |
A |
10.0 |
162 |
A |
7.0 |
90 |
Rte. 53 – SB |
(L) |
— |
— |
— |
A |
5.8 |
4 |
— |
— |
— |
Rte. 53 – SB |
T (TR) |
A |
9.3 |
199 |
C |
30.8 |
#446 |
D |
43.3 |
#516 |
Rte. 53 – SB |
R |
A |
2.7 |
39 |
— |
— |
— |
— |
— |
— |
Overall |
— |
B |
10.7 |
— |
C |
23.5 |
— |
C |
30.8 |
— |
1 2005 “before” existing traffic volumes from FDR. 2 2015 “projected” future traffic volumes with build conditions from FDR. 3 2014 “after” existing traffic volumes. 4 Delay is measured in seconds. 5 Queue length is measured in feet.
Notes: (x) Turning lane configuration in Projected/After conditions. # = 95th percentile volume exceeds capacity, queues may be longer.
Source: Central Transportation Planning Staff.
Based upon data provided in the FDRs, reviewing the project studies, and analyzing the 11 study intersections post-reconstruction, we conclude the following, which should be taken into consideration in future transportation projects:
Crash modification factors may be used to quantify the safety benefits associated with several operational and safety countermeasures implemented at study locations. Recently, CMFs were developed in order to understand and quantify the operational and environmental effects of design decisions. Crash modification factors measure the safety efficacy of a particular treatment or design element, and are used to compute the expected number of crashes after implementing a given countermeasure at a specific site. Table 28 outlines the CMF associated with improvements of the projects cited in this report.
TABLE 28
Crash Modification Factors by Improvement
Improvement |
CMF |
Crash Type |
Severity |
|---|---|---|---|
Install left-turn lane |
0.79 |
All |
Fatal, Serious Injury, Minor Injury |
|
0.80 |
All |
PDO |
Install right-turn lane |
0.91 |
All |
Fatal, Serious Injury, Minor Injury |
Install traffic signal |
0.83 |
All |
All |
|
1.48 |
Rear-end |
All |
Improve signal visibility |
0.71 |
All |
Fatal, Serious Injury, Minor Injury |
Install crosswalk |
0.35 |
All |
All |
Install pedestrian countdown timer |
0.30 |
Veh/ped |
All |
Install two-way left-turn lane |
0.92 |
All |
All |
Convert phasing from permissive to protected |
0.99 |
All |
All |
Source: Central Transportation Planning Staff.
Although there was sufficient data to compare vehicular turning-movement volumes and traffic analysis, crash data for several study intersections was limited. As a result, staff could not compute the actual number of crashes that were reduced because of the reconstruction. In addition, because of the lack of requisite data at the studied intersections in the before period, it was not possible to analyze bicycle and pedestrian operations comprehensively.
ASN/asn
1 MassDOT Project Information Website: http://www.mhd.state.ma.us//default.asp?pgid=content/projectsRoot&sid=wrapper&iid=http://www.mhd.state.ma.us//ProjectInfo/
2 Synchro Version 8 was used for these analyses. This software is developed and distributed by Trafficware Ltd. It can perform capacity analysis and traffic simulation (when combined with SimTraffic) for an individual intersection or a series of intersections.