Technical Memorandum
DATE: July 9, 2015
TO: Boston Region Metropolitan Planning Organization
FROM: Nicholas Hart, Transportation Planner
RE: Limited-Stop Study, Phase 1: Review of Limited-Stop Bus Service
This technical memorandum provides a literature review of strategies for implementing effective limited-stop bus service. The introduction to the memorandum is followed by a literature review that is divided into two sections: the first section is a review of strategies derived from various modeling approaches and the second section is a review of strategies derived from case study research. The final section of this memorandum consists of a summary of the findings of this phase of the study, and a summary of the study’s next steps.
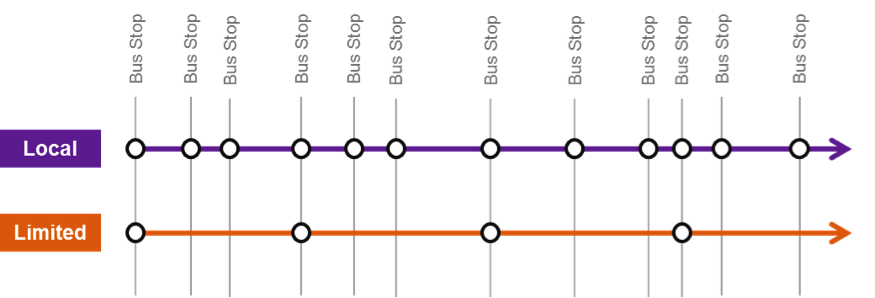
The Massachusetts Bay Transportation Authority (MBTA) regularly receives requests from elected officials and the public for limited-stop bus service in many of its Key Bus Route and other high-ridership bus routes and corridors. In general, limited-stop bus routes operate by providing service to the most heavily patronized stops along a corridor in combination with a local route that provides service to all stops. Limited-stop service is advantageous because it produces faster running times along the route or corridor than those of local service, and it increases efficiency in terms of the number of trips a vehicle can make along the route or corridor in a given time span. These faster running times result in shorter in-vehicle travel times than local-service travel times for customers along the route or corridor, making limited-stop service more attractive and, by attracting more riders, effectively reducing the total cost per passenger trip. Furthermore, limited-stop service has been found to be more reliable than previously existing local-only service along a route or corridor while also decreasing crowding on board buses. Limited-stop service has been operated successfully in many cities in the United States and around the globe, including New York City, Los Angeles, Montreal, and Bogota. A schematic representation of limited-stop service is shown in Figure 1.
FIGURE 1
Schematic of Limited-Stop Service
Source: CTPS.
Limited-stop service can be implemented in two ways: (1) by adding limited-stop buses as an addition to existing local service for a route or corridor, or (2) by replacing some local bus trips with limited-stop trips. The second strategy, known as a “resource-neutral” strategy,” offers the greatest potential for cost savings. However, assigning the existing vehicles on a route or corridor to both limited-stop and local service have some drawbacks, which include longer waiting time (time spent waiting at the boarding location), increased access time (time spent traveling to the boarding location), and/or increased egress time (time spent traveling from the alighting location to the final destination) for certain passengers.
The objective of this first phase of the three-phase study was to examine existing case studies (of actual transit services) and academic studies (based on computer models) that explored the topic of limited-stop service. This examination was conducted in order to identify benchmarks for gauging the potential for successful implementation of limited-stop service on existing local service routes and corridors. In the second phase, the findings presented in this memo were used to develop a set of criteria to be used as standards for evaluating an existing bus route or corridor’s potential to support effective limited-stop bus service as a complement to its existing local service.1 In phase three, the criteria from the second phase were applied to the MBTA’s Key Bus Routes and other heavily utilized MBTA bus routes and corridors.2 The evaluations of MBTA bus routes and corridors were then prioritized for further assessment of their potential for adding limited-stop service.
This section summarizes the findings of academic research and of the findings of case studies that examined the topic of limited-stop service.
In this study, Schwarcz reported on a computer model that had been developed to evaluate the potential for limited-stop bus service based on proposed stop locations and local and limited-stop headways. The model was calibrated using information on existing vehicle running times and the passenger demand at each stop. The model minimized the total expected passenger travel time along the route by assigning demand to origin-destination pairs for the limited-stop and local-stop service. From the resulting person-trip patterns, several measures of effectiveness were calculated to evaluate different sets of service configurations. These measures of effectiveness were defined as:
The model was calibrated using two Chicago Transit Authority (CTA) corridors: the Western Avenue local Route 49 and limited-stop Route X49, and the Madison Avenue Route 20. Following the calibration, Schwarcz performed a sensitivity analysis of the model, which was used to develop two sets of guidelines—one set for evaluating routes and corridors for limited-stop potential, and another for the design of limited-stop service. The following principles, which were revealed during the sensitivity analysis, underlie the final recommendations proposed by Schwarcz:
The first set of guidelines developed by Schwarcz was for methods of identifying the existing bus routes and corridors that have limited-stop-service potential. These guidelines encompassed the categories of ridership and existing headway, passenger trip length, demand concentration, and running-time savings potential along existing corridors. CTPS’s summary of these guidelines is presented below.
Ridership and Existing Headway
The guidelines state that the total ridership on a route or corridor is an important indicator of whether limited-stop service is likely to be viable, but do not specify a minimum ridership level required to support such service. Instead, it is implied that short headways on an existing route or corridor under consideration for limited-stop service indicate that the route or corridor has heavy ridership.
According to the guidelines, if limited-stop trips are to be run in place of some local trips, the resulting limited-stop headway must be no greater than 10 minutes in order to provide sufficient travel-time savings to divert riders from the remaining local service. For limited-stop service to be effective, the headway of the existing local route or corridor should ideally be five minutes or less and no more than seven minutes.
Passenger Trip Length
Routes or corridors on which limited-stop service is most likely to be effective are those on which at least 60 percent of passengers make trips longer than two miles and at least 10 percent make trips longer than five miles.
Demand Concentration
Limited-stop service is likely to be successful on routes or corridors on which a small percentage of all stops account for a high proportion of the total demand. A route that has a small percentage of stops that account for a high proportion of total demand is considered to have a “high concentration” of demand. A route on which demand is spread fairly evenly along the route is considered to have a “low concentration” of demand. An example of a hypothetical bus route or corridor (referred to as Route A) that has highly concentrated demand is shown in Figure 2. An example of a hypothetical bus route or corridor (referred to as Route B) that has less-concentrated demand is shown in Figure 3.
FIGURE 2
Sample Route A – Highly Concentrated Demand
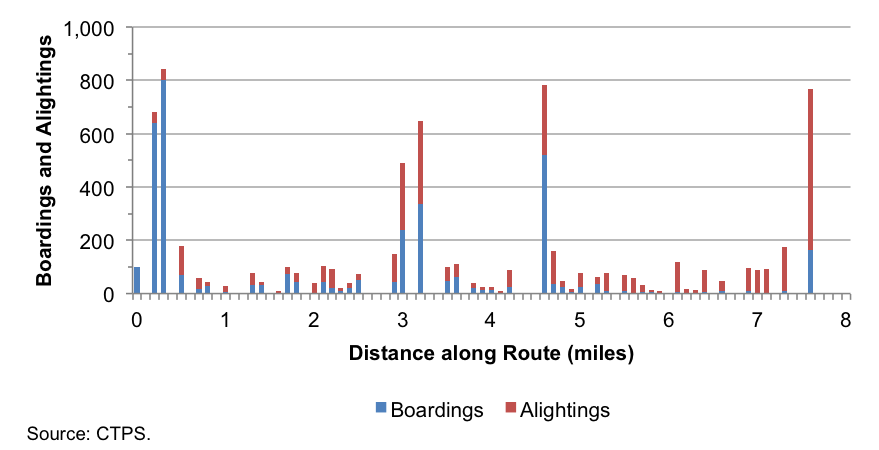
Figure 3
Sample Route B – Less-Concentrated Demand
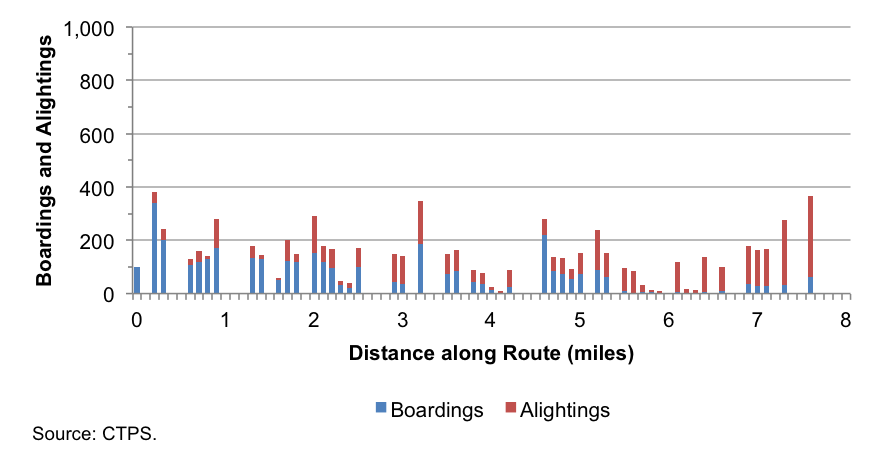
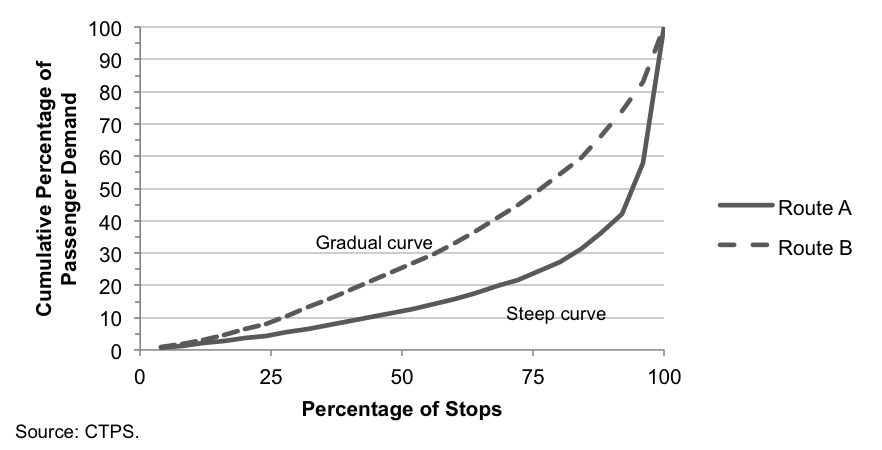
The guidelines recommend using a graph known as a cumulative demand curve to compare the demand concentration of different routes and corridors. The required input for such graphs is stop-by-stop passenger boarding and alighting totals, obtained through manual or electronic counts. With the stops sorted in order of total ridership activity from lowest to highest, the results are plotted on a graph that shows the cumulative percentage of total stops on the x-axis and cumulative percentage of total ridership on the y-axis. The steeper the resulting curve (that is, the lower the percentage of stops for a given percentage of ridership), the higher the demand concentration. (Such graphs do not account for either the absolute number of stops or absolute ridership, so a short route or corridor with low ridership could have higher demand concentration than a long route or corridor with heavy ridership.) Figure 4 is an example of this type of graph. Data for the hypothetical routes shown in Figures 2 and 3 indicate that Route A’s highly concentrated demand results in a steep cumulative demand curve, and Route B’s less-concentrated demand results in a gradual cumulative demand curve. Route A’s steeper curve indicates that it is a better candidate for limited-stop service based on this guideline.
FIGURE 4
Sample Cumulative Demand Curve
Running-Time Savings Potential
Implementation of limited-stop service is worthwhile only if it results in travel-time savings compared with the existing local-stop service on the same route or corridor. This requires that the limited-stop buses be able to easily pass slower local-stop buses. This is usually possible only on roads with two travel lanes in each direction, but on some roads with only a single lane in each direction there is enough room for local buses to pull over at stops to let other vehicles pass. On multilane roads, a bus making frequent stops usually has to stay in the travel lane nearest to the curb. A bus traveling longer distances between stops has more opportunity to maneuver into faster-moving lanes.
The second set of guidelines developed by Schwarcz addressed the design of effective limited-stop service. These guidelines encompassed the categories of stop spacing, running time, and limited-stop frequency share. CTPS’s summary of these guidelines is presented below.
Stop Spacing
A well-designed limited-stop service should cover all of the high-demand stops served by the local route, including transfer points with other routes. It may also include some moderate-demand stops, but should omit all low-demand stops. Maximum travel-time savings are attainable only with long stop spacing, but a route with too few stops may serve too few riders to be effective.
As shown in the graph (Figure 4) of the cumulative percentage of stops versus the cumulative percentage of ridership, the curve for hypothetical Route A, with highly concentrated demand, begins to climb steeply at approximately 75 percent of stops. (Routes with uniformly flat curves, such as hypothetical Route B, will have been previously screened out during the route selection process.) Because stops are sorted in ascending order of ridership to create the graph, the stops located on the steepest portion of the curve are selected as the stops to be initially considered for limited-stop service. Transfer points that are not on the steep portions of the curve may also be considered as stops on limited-service routes.
If some of the high-ridership stops selected from the graph are spaced too close together, they may have to be omitted or combined to achieve desired travel-time savings. The guidelines call for stop spacing in the final limited-stop route design to be at least 0.3 miles, possibly ranging up to one mile, depending on other route characteristics.
Running Time
The objective of stop reduction is to reduce vehicle running times and passenger travel times. However, traffic conditions on the streets used by a route may limit the potential running-time reductions. In such cases, travel-time savings are proportionally less than running-time savings because the average waiting times for passengers increases, which results in some passengers using the limited-stop service having longer access or egress times than they would have had with the local-stop service.
Under these guidelines, limited-stop service should not be implemented unless net travel-time savings are predicted to exceed 15 percent. For estimation of potential travel-time savings, the guidelines recommend using automatic vehicle location (AVL) data if available, and for computer modeling, they recommend using PTV Vissim or other microsimulation software.
Limited-Stop Frequency Share
Schwarcz concludes that when service on an existing local-service route or corridor is partially replaced with limited-stop service, at least 60 percent of trips for the combined new service should be provided by limited-stop buses. In addition to attracting new transit riders who found travel times on the old local-stop service too slow, providing a high percentage of limited-stop bus service encourages passengers who would have used local-only stops to divert to stops served by limited-stop buses. However, caution must be exercised, since a frequency share of greater than 60 percent for the limited-stop service has a significant impact on local-stop service, especially if it results in headways of greater than 10 minutes for the local service. The guidelines recommend that in such cases, the local-service be set to a clock-face headway.
In this study, Scorcia developed improvements to Schwarcz’s model by incorporating a probabilistic choice approach6 when forecasting the changes in passenger demand that result from implementing limited-stop service. In comparison, Schwarcz’s methodology for assigning passenger demand used a deterministic approach,7 which minimizes each passenger’s weighted travel times, but ignored other variations in preference among users.
Scorcia’s updated methodology used data from a set of surveys distributed among limited-stop bus corridors in Chicago. For stops that had both limited-stop and local service, data from the surveys indicated:
Among the explanations offered for the low percentage of limited-preferred customers were the frequency share of the limited-stop service (50 percent or less in some cases8), a larger weight on waiting and access times than on in-vehicle travel time, short trip lengths, a high number of limited-stop buses bunched behind local buses, difficulty walking for some passengers, and a lack of familiarity with the limited-stop service of some customers (13 percent of those surveyed).
Using the survey data, a set of utility functions was developed for each of the following strategies: (1) waiting for the local service, (2) waiting for the limited-stop service, and (3) taking the first bus that comes. As was expected, the parameters of the utility functions showed that the out-of-vehicle travel time component is more onerous than the in-vehicle time, and for the case of the surveyed limited-stop services in Chicago, if out-of-vehicle and in-vehicle travel times are equal for local and limited-stop service, the most-preferred strategy is waiting for the local bus, the second-most-favored strategy is taking the first bus that comes, and the least-favored strategy is waiting for the limited-stop service. Using the developed utility functions, the model performed passenger assignment in three steps:
Once the results of the passenger assignment had been obtained, the model evaluated the service configuration based on the following indicators:
Scorcia applied the model to two Chicago Transit Authority (CTA) corridors—Chicago Avenue and 79th Street—and, based on the resulting calibration, developed a set of general recommendations for limited-stop corridor selection and limited-stop service configuration. The set of guidelines that was designed to identify existing bus routes and corridors with limited-stop service potential encompassed three of the same categories as in Schwarcz’s study: ridership and existing headway, passenger trip length, and demand concentration. CTPS’s summary of these guidelines is presented below.
Ridership and Existing Headway
Scorcia’s guidelines state that the total ridership on a route or corridor is an important indicator of whether limited-stop service is likely to be viable, as did Schwarcz’s. However, Scorcia did not specify a minimum ridership level required to support such service. Instead, it is implied that short headways on an existing route or corridor under consideration for limited-stop service indicate that the route or corridor has heavy ridership.
According to Scorcia’s guidelines, if limited-stop trips are to be run in place of some local trips, the maximum headway on either service should not exceed 15 minutes, and a local route or corridor under consideration for limited-stop service should have existing headways of 8 minutes or less. Implementing a limited-stop service with long headways increases the average travel time along the route or corridor, and results in most passengers’ walking to a combined stop and boarding the first bus that comes. Generally, high-demand routes and corridors that support existing headways of 5 minutes or less are the best candidates for new limited-stop service.
Passenger Trip Length
Routes or corridors on which limited-stop service is most likely to be effective are those with longer average passenger trips, since for longer trips, the reduction in in-vehicle travel time is more likely to compensate for the increases in access, egress, and waiting times for resource-neutral implementation strategies. Scorcia's analysis of limited-stop corridors in Chicago indicated that longer trips have larger travel time elasticities than shorter trips. Therefore, longer trips attract a higher percentage of passengers who prefer limited-stop service than do local trips. An average passenger trip length of three miles or more is recommended.
Demand Concentration
Limited-stop service is likely to be successful on routes and corridors on which a small percentage of stops accounts for a high proportion of total demand. A high concentration of stop origins and destinations is desired since it allows the limited-stop buses to serve most of the demand without increasing access and egress times for the limited-preferred and choice riders. These limited-preferred and choice riders represent more than 60 percent of the market in the surveyed Chicago corridors where limited-stop service had been introduced. Additionally, CTPS calculated from the survey data presented in the report that about 12 percent of demand at local stops corresponds to local-preferred riders.10 CTPS interpreted this finding as suggesting that at least 72 percent of the total demand along an existing route or corridor, and preferably more, should be concentrated within the stops under consideration for adding limited-stop service.
Scorcia developed a set of guidelines for designing effective limited-stop service that encompassed two of the same categories as in Schwarcz’s guidelines: stop spacing and limited-stop frequency share. CTPS’s summary of the guidelines is presented below.
Stop Spacing
Limited-stop service should include the stops that had the highest demand, regardless of whether they are equidistant from each other. Therefore, there is no “optimal” stop spacing, and the characteristics of each route or corridor determine the most effective stop-spacing strategy. Scorcia proposed a methodology that is similar to that developed by Tétreault and El-Geneidy, whose work is summarized following the review of Scorcia’s study.
Limited-Stop Frequency Share
Scorcia’s examination of the model results of the studied corridors and CTA’s operating experience reveals that the ratio of bus trips that are provided on limited-stop service to the trips provided on local service should be at least 1:1. However, it is desirable to use larger ratios (for example, 3:2 or 2:1) since those ratios result in more even passenger distribution between the local and limited-stop service (in other words, scenarios in which limited-stop service is equally or more crowded than the local service). When evaluating different frequency shares, it is found that 1:1 ratios provide faster limited-stop service than larger frequency shares at the expense of carrying fewer passengers.
Tétreault and El-Geneidy developed a methodology for selecting stops for a limited-stop bus service, and used archived AVL and automated passenger counting (APC) data to estimate the run times for a limited-stop service implemented along bus Route 67 in Montreal. Three methods were analyzed for selecting stops for potential limited-service. The first method selected all of the stops that were transfer points. The second method utilized existing APC and AVL data to select the top 25 percent of stops along the route ranked by passenger activity, where activity was defined as the total number of boardings and alightings per stop. The third method used data from an origin-destination (O-D) survey to select the top 25 percent of stops along the route ranked by passenger activity, where passenger activity was defined as the total number of trip ends.
The second of these three methods, which used APC and AVL data, was found to be the best way to select stops for potential limited-stop service. However, all three scenarios were found to be imperfect, as none of them considered the distance between the selected stops. Therefore, a fourth scenario was developed; it used APC and AVL data and emphasized the importance of attempting to ensure an average spacing of 800 to 1,600 meters (approximately 0.5 to 1.0 miles), while keeping 25 percent of the existing stops in the new limited-stop service. In this improved method, the initial step was selecting stops that had the most passenger activity, which generally leads to the selection of major generators such as metro stations and intersecting high-ridership bus routes. After this initial step, the set of selected stops was refined to provide more space between stops and less clustering of stops. The authors recommended the use of this scenario because it utilizes various criteria to select stop locations including demand, transfer points, walking distances to (and from) bus stops, and savings in travel time.
As part of the same research project, a computer model estimating running times for limited-stop service was developed. Through a before-and-after study, El-Geneidy and Surprenant-Legault found that the run-time estimations provided by Tétreault and El-Geneidy fell within acceptable ranges when compared to the observed run times of the actual limited-stop service.12
Chiraphadhanakul and Barnhart proposed an optimization model (with a resource-neutral implementation constraint) to determine: (1) the bus stops along a route or corridor to be served by limited-stop service, and (2) the frequencies of limited-stop and local services that maximize total user welfare, for a given route or corridor during a given time period. In their model, user welfare is defined as the total in-vehicle time savings minus the total increase in wait time forlimited-stop and local-stop users combined, which included a higher penalty for increased wait time than for increased in-vehicle time. To provide insights into the effects of the key attributes of the design of limited-stop bus service, the optimization model was calibrated individually for each of the 178 bus routes and corridors studied, which had varying characteristics.
It was found that the greatest user welfare can be attained by implementing limited-stop service on routes and corridors that have the highest initial service frequency, and on which increased wait times resulting from replacement of local trips with limited-stop trips does not offset in-vehicle time savings. User welfare was also found to be highly correlated with the average passenger trip length, as passengers making the longest trips benefited the most from improved vehicle speeds, which were made possible by serving fewer stops. Additionally, user welfare was found to have only a limited correlation with the total demand and route length because higher volumes and longer route lengths did not necessarily result in longer average trip lengths.
Although of the presence of highly concentrated demand is commonly used as an indicator for assessing limited-stop potential, Chiraphadhanakul and Barnhart did not find a strong correlation between the presence of highly concentrated demand and user welfare. This was because when high-demand stops were spaced close together in the model, there were minimal reductions in total travel time, because of longer access, egress, and wait times for passengers along the corridor. While routes and corridors with a presence of highly concentrated demand generally allow limited-stop service to serve a higher number of passengers while making fewer stops, Chiraphadhanakul and Barnhart recommend that the distribution of the high-demand stops must also be taken into consideration.
Studies by Leiva et al.14 and Ulusoy et al.15 also proposed optimization approaches to modeling limited-stop service, with similar findings.
New York City Transit (NYCT) first began operating limited-stop bus service more than 35 years ago to address customer complaints about slower bus travel speeds from increased street traffic, and to address market competition from the emergence of the van/taxicab industry. As of 2012, NYCT’s limited-stop service had expanded to 41 routes, 10 of which operate seven days a week. These routes serve all five boroughs of New York City, and cover a spectrum of operating environments, ranging from densely populated urban corridors to less-densely populated corridors with suburban land-use qualities.
Writing during the height of the expansion of NYCT limited-stop bus service, Silverman provided a comprehensive assessment of the factors deemed to have contributed to its success. These factors primarily involved elements of time and geography, but also reflected elements of passenger volume, customer travel patterns, coordination with other services and modes, and cost versus revenue.
With regard to the operating environment, Silverman found that the limited-stop routes and corridors that operated most effectively met the following criteria.
The combination of the above factors allowed existing limited-stop buses to maneuver more freely from the curbside or from the right traffic lane into a more free-flowing traffic lane, should one exist. This increased onboard travel-time savings by allowing limited-stop buses to easily bypass turning traffic, double-parked cars, and local buses.
In addition, Silverman found that because limited-stop buses traveled faster than local-service buses, they operated more efficiently over longer distances (in other words, passengers accrued greater travel-time savings). As a result, NYCT local buses would typically short-turn18 at one or both ends of a route or corridor, while the limited-stop service operated along the entire length of the route or corridor. The limited-stop service made only limited stops in the portion of the corridor that received local service, and made all of the local stops in the portions of the corridor that did not receive local service. At the time the study was conducted, NYCT limited-stop routes ranged in length from 5.1 to 10.7 miles, with an average length of 8.3 miles.
Silverman categorized NYCT bus routes that offer limited-stop service into two classes: (1) feeder routes, which have a terminal that is a transportation hub or other type of high-volume trip generator; and (2) grid routes, which have multiple high-volume trip generators distributed along the length of the route. Each of these classes had market characteristics that become apparent when comparing the two. In general, many of the grid routes were in areas with a high population density, and many of the feeder routes were in areas with a lower population density. On average, grid routes (9.2 miles) were longer than feeder routes (7.4 miles). Silverman found that operating speeds also varied significantly between grid and feeder routes and between local and limited-stop service. On feeder routes, local service averaged 11.3 mph, while limited-stop service averaged 12.9 mph. On grid routes, local service averaged 7.2 mph, while limited-stop service averaged 8.7 mph. This information is summarized in Tables 1 and 2.
TABLE 1
Limited-Stop Service by Class in New York City
Class |
Characteristics |
Operating Environment |
Average Length |
|---|---|---|---|
Feeder |
Serves a transportation hub or other type of high-volume trip generator at its terminal |
Low population density |
7.4 mi |
Grid |
Multiple high-volume trip generators along the route at which passengers board or alight |
High population density |
9.2 mi |
Source: N.C. Silverman, “Limited-Stop Bus Service at New York City Transit,” Journal of Transportation Engineering, 1998, pp. 503–509.
TABLE 2
Average Speed by Class of Routes Offering
Limited-Stop Service in New York City
Class |
Local Service |
Limit-Stop Service |
Increase |
|---|---|---|---|
Feeder |
11.3 mph |
12.9 mph |
14.2% |
Grid |
7.2 mph |
8.7 mph |
20.8% |
Source: N.C. Silverman, “Limited-Stop Bus Service at New York City Transit,” Journal of Transportation Engineering, 1998, pp. 503–509.
As shown in Table 2, there was a higher average speed increase for limited-stop service on grid routes than on feeder routes. Part of this difference was explained by the nature of boardings and alightings for each class of service. Grid routes had boarding and alighting activity at almost every limited-service stop. On feeder routes, many stops had only boardings in the travel direction toward the transfer point, and only alightings in the opposite direction, resulting in shorter average dwell times than at the stops with both boarding and alighting activity.
In Silverman’s discussion about how to schedule effective limited-stop service at NYCT, Silverman stated that passenger volume on the route should be high enough to support a 5-minute minimum combined headway, equivalent to a 10-minute minimum headway on the limited-stop service and a 10-minute headway on the local service it compliments if service were allocated equally between them. (As of 2012, NYCT had increased this threshold to a 6-minute combined headway.) Silverman also suggested that limited-stop service should not account for more than 50 percent of trips on a grid-route corridor, or 70 percent of trips on a feeder-route corridor.
Another important factor to consider when scheduling effective limited-stop service is operating at evenly spaced time intervals, at stops that are shared by both types of service, between the arrival of limited-stop and local buses. One method NYCT had adopted to address this issue was to time each service so that the combined headways were constant at either the maximum load point or at one end of the shared segment of the corridor. Another method consisted of treating local service and limited-stop service as separate routes, and scheduling them without considering their combined headways. Silverman provided suggestions about how to select one of these two methods, based on the frequency of limited-stop service provided on the route or corridor. When there were only a few limited-stop trips during the peak hour, it was often most effective to coordinate those trips with the local service schedule. However, when limited-stop service had a higher service frequency, neither method was considered superior, and a scheduling strategy was adopted on a case-by-case basis.
Another important consideration of NYCT was the time span during which limited-stop service operated. NYCT’s most successful limited-stop corridors were those with high passenger volumes that supported relatively long durations of limited-stop service. Very short durations of limited-stop service created service schedules that were confusing and not easy for passengers to remember, which was detrimental to customer perception of limited-stop service. An example of this occurred when limited-stop service was first introduced in Manhattan— four of the limited-stop routes had fewer than six departures during each AM and PM peak period. The minimal level of limited-stop service did not provide a sufficiently attractive alternative to local service, and the even headways of pre-existing local service along the corridor were no longer even. As a result, passengers perceived the change as a degradation of, rather than an improvement to, the former level of local service. In addition, passengers traveling during peak periods were typically more time-sensitive than off-peak passengers, since peak-period ridership was largely made up of trips to work locations with fixed reporting times, and off-peak ridership had a larger percentage of non-work trips and trips by passengers without other transportation alternatives.
In 1998, when the Silverman study was conducted, NYCT operated 25 limited-stop routes. Of these, 14 operated only during peak hours—11 of those routes operated only in the peak direction. The weekday limited-stop service had four categories of time spans:
At that time, market research conducted by NYCT indicated that passengers respond “very positively” to limited-stop service. Even passengers who continued to board at local-bus stops expressed favorable impressions of limited-stop service. The faster trips offered by limited-stop service increased customer satisfaction on the routes and corridors where it had been introduced; this was partly because the perceived travel-time savings were often as much as twice the actual savings. Nevertheless, the introduction of limited-stop service led to significantly improved market retention on the routes and corridors where it was provided. This was remarkable at the time, as systemwide bus ridership at NYCT had been in a 20-year decline.
Sholler provided a detailed case study of limited-stop bus service on the Massachusetts Bay Transportation Authority’s Route CT1. Currently, Route CT1 is the only example of limited-stop bus service in the MBTA system. This route runs between Central Square in Cambridge and Boston University Medical Center in Boston’s South End neighborhood via MIT. Route CT1’s local counterpart, Route 1, runs between Harvard Square in Cambridge and Dudley Square Station in Roxbury via Boston Medical Center. Route CT1 overlaps with approximately 70 percent of Route 1, on Massachusetts Avenue in Cambridge and Boston. The average Route CT1 stop spacing of 0.27 miles is more than double the average spacing of 0.13 miles on Route 1. At the time this memorandum was written, no portion of either route had transit signal priority or offered any form of lane exclusivity or queue jumping.
In 2003, at the time of Sholler’s study, scheduled headways on the local Route 1 were 10 to 12 minutes during the AM and PM peak periods, and 15 to 20 minutes during off-peak periods. Route CT1’s scheduled headways were 15 minutes during the AM and PM peak periods, and 30 minutes during off-peak periods. Route 1 carried approximately 12,500 passengers per day, while Route CT1 carried approximately 2,200. The combined peak-hour volume for the corridor was 460 inbound passengers, observed from 7:45 AM to 8:45 AM, with 60 percent carried by Route 1. Table 3 displays a summary of this information and recent (2012) statistics.
TABLE 3
Route 1 and CT1 Summary Statistics
Service Metric |
2003 Route 1 |
2003 Route CT1 |
2012 Route 1 |
2012 Route CT1 |
|---|---|---|---|---|
Peak headway |
10–12 min |
15 min |
8 min |
23 min |
Off-peak headway |
15–20 min |
30 min |
10–14 min |
30 min |
Weekday passengers |
12,500 ppd |
2,200 ppd |
13,200 ppd |
2,200 ppd |
Peak volume* |
276 pph |
184 pph |
547 pph |
173 pph |
Source: 2012 data from CTPS; and 2003 data from M. Sholler, “Evaluating Express Bus Service,”master's thesis, Massachusetts Institute of Technology, 2003.
Note: The 2012 ridership statistics were derived from fall 2012 APC data
* Measured inbound from 7:45 AM to 8:45 AM
ppd = passengers per day
pph = passengers per hour
Sholler’s study analyzed the total travel-time savings offered by Route CT1 using two different headway scenarios: matched and unmatched.20 This case study demonstrated that implementing limited-stop trips that have long headways can be detrimental to the success of limited-stop service. On routes such as Routes 1 and CT1, which have short average passenger trip lengths, in-vehicle travel-time savings from increased operating speeds can easily be offset by increased wait time if the limited-stop headways are longer than those of the local route. Therefore, Sholler recommended that limited-stop headways be close to those of the corresponding local route in order to provide a net time savings to passengers along the corridor.
Table 4 displays the route characteristics that were used to estimate the passenger trip times for Routes 1 and CT1 under the conditions at the time of the study. Table 5 shows how these route characteristics translated to travel-time estimates over each passenger trip segment. Sholler estimated that the average wait time for Route 1 operating at 10-minute headways would be 5 minutes, whereas Route CT1 operating with 15-minute headways would have an average wait time of 7.5 minutes. This was based on an assumption that the arrival of passengers at boarding stops is uniformly distributed between the arrival times of successive bus trips. However, this is not always the case, especially when service is reliable and passengers can plan their arrival based on the scheduled times. Additionally, since a local route and its corresponding limited-stop route generally follow the same alignment, passengers making short-distance trips that can be made on either service are likely to board whichever bus arrives at their stop first. Each of these factors increases the variability of the actual access and wait times for each type of service.
TABLE 4
Study Conditions
Route Characteristic |
Route 1 |
Route CT1 |
|---|---|---|
Headway |
10 minutes |
15 minutes |
Average passenger trip distance |
2.4 miles |
2.4 miles |
Average stop spacing |
686 feet |
1426 feet |
Time per stop |
15 seconds |
15 seconds |
Moving speed |
8 miles/hour |
9 miles/hour |
Source: Figure 2-7 in M. Sholler, “Evaluating Express Bus Service,” master's thesis, Massachusetts Institute of Technology, 2003.
TABLE 5
Passenger Trip Times with Study Conditions
Time |
Route 1 |
Route CT1 |
|---|---|---|
Access |
5 minutes |
5 minutes |
Wait |
5 minutes |
7.5 minutes |
Ride |
22.6 minutes |
18.2 minutes |
Egress |
5 minutes |
5 minutes |
Total travel time |
37.6 minutes |
35.7 minutes |
Source: Figure 2-7 in M. Sholler, “Evaluating Express Bus Service,” master's thesis, Massachusetts Institute of Technology, 2003.
Sholler estimated Route CT1 to have a total travel time of 35.7 minutes, only 1.9 minutes faster than Route 1. Under these conditions, the average limited-stop user waits 2.5 minutes more than a local service user, with a resulting time savings of only 1.9 minutes per trip. The increase in the average wait time was detrimental to the customer’s perception of their total travel-time savings. To make matters worse, any variability from the assumptions made in the analysis, or reductions in the reliability of bus service along the corridor, would have had an adverse effect on access and wait times for the limited-stop service, which would have increased the likelihood that both perceived and actual travel-time savings were negligible under this headway configuration. These findings would be amplified under today’s (2015) schedule, with Route CT1 operating at 20-minute headways during the peak period and 30-minute headways during the off-peak period.
To achieve improved travel-time savings, Sholler proposed that headways on Route CT1 should be equivalent to those on Route 1. Table 6 shows Sholler’s analysis of a scenario in which headways on Route CT1 would be reduced to 10 minutes to match those of Route 1. Table 7 shows that in this scenario, with all other variables held constant, the resulting average wait times of 5 minutes for each route would produce an estimated total travel time of 33.2 minutes on Route CT1, 4.4 minutes less than the time on Route 1, and 2.5 minutes less than the time on Route CT1 under the conditions at the time of the study. With equal wait times on both routes, passengers would be more likely to perceive and attain travel-time savings than they would when the limited-stop service has longer headways.
TABLE 6
Matched-Headway Scenario Conditions
Route Characteristic |
Route 1 |
Route CT1 |
|---|---|---|
Headway |
10 minutes |
10 minutes |
Average passenger trip distance |
2.4 miles |
2.4 miles |
Average stop spacing |
686 feet |
1426 feet |
Time per stop |
15 seconds |
15 seconds |
Moving speed |
8 miles/hour |
9 miles/hour |
Source: Figure 2-7 in M. Sholler, “Evaluating Express Bus Service,” master's thesis, Massachusetts Institute of Technology, 2003.
TABLE 7
Passenger Trip Times in a Matched-Headway Scenario
Time |
Route 1 |
Route CT1 |
|---|---|---|
Access |
5 minutes |
5 minutes |
Wait |
5 minutes |
5 minutes |
Ride |
22.6 minutes |
18.2 minutes |
Egress |
5 minutes |
5 minutes |
Total travel time |
37.6 minutes |
33.2 minutes |
Source: Figure 2-7 in M. Sholler, “Evaluating Express Bus Service,” master's thesis, Massachusetts Institute of Technology, 2003.
The schedule adherence of Routes 1 and CT1 in Table 8 shows the possibility for further discrepancy between customers’ perceived and actual travel-time savings on Route CT1. As can be seen, on-time departures for Route CT1 were 100 percent in both directions; however, the percentage of on-time arrivals decreased significantly, and was less than the percentage of on-time arrivals for the local (Route 1) service. With less reliable service, wait times for Route CT1 increased more on average than they did on Route 1, which decreased Route CT1’s net travel-time savings, and further reduced customer’s preference for that service.
TABLE 8
Schedule Adherence for Route 1 and CT1
Route |
On-Time Inbound Departures |
On-Time Outbound Departures |
On-Time Inbound Arrivals |
On-Time Outbound Arrivals |
|---|---|---|---|---|
Route 1 |
89.7% |
88.8% |
49.5% |
52.7% |
CT1 |
100% |
100% |
34.2% |
25% |
Source: Figure 2-8 in M. Sholler, “Evaluating Express Bus Service,” master's thesis, Massachusetts Institute of Technology, 2003.
Sholler provided the following summary of critical observations from the CT1 case study:
Although not directly associated with the identification or design of limited-stop corridors, the work of Schwarcz and Wyss provides interesting insight into some of the operational factors that must be considered once limited-stop service has been implemented. Schwarcz and Wyss studied the effects of ending the practice of adhering to midroute timepoints on four of NYCT’s limited-stop routes and corridors during the spring of 2010: Routes B35, Q43, B6, and Q17. Their study was undertaken in response to frequent customer complaints that NYCT had received related to bus operators’ driving slowly or waiting at green lights in order to adhere to scheduled midroute timepoints. These practices were especially frustrating for limited-stop riders, who tended to be more interested in reducing their travel time than were users of the local service. In general, the pilot project was expected to have a positive effect, but at the cost of a possible reduction in reliability, since the purpose of intermediate timepoints is to keep trips on schedule. The three stated objectives of the pilot program were: (1) to eliminate holding at green lights and unnecessary holding for schedule adjustments, (2) to reduce running times and customer trip times, and (3) to improve customer satisfaction by reducing onboard travel times.
To conduct the study, NYCT removed all intermediate timepoints from the schedules of the limited-stop routes and corridors in the pilot program, with the exception of short-turn and relief points.23 Limited-stop bus operators were instructed to pass the bus ahead of them if wheelchair users were boarding or if it was delayed for any other reason. Furthermore, dispatchers were asked to break up bunched vehicles24 if necessary. Local services on the same routes and corridors continued to adhere to all scheduled timepoints. NYCT did not inform customers of these changes.
Three measures of effectiveness were used to evaluate the pilot program: travel time, headway regularity, and customer satisfaction. Individual analyses for each case-study route and corridor indicated that on a majority of the limited-stop routes studied, not requiring adherence to midroute timepoints appeared to have reduced onboard travel times, while reliability remained the same and customer satisfaction generally improved. The results of the analysis are summarized in Table 9.
TABLE 9
NYCT Case Study Analysis Summary
Limited-Stop Route |
Running-Time Savings |
Wait Time |
Local/ Limited-Stop Ridership Split |
Customer Perceptions |
Local-Service Analysis |
|---|---|---|---|---|---|
B35 |
2 min |
Reduced 2% |
No change |
Improved overall on limited-stop service |
Reduced travel time, reduction in reliability |
Q43 |
2 min |
Increased 3% |
N/A |
Noticed an improvement in trip speed |
N/A |
B6 |
1 min |
No change |
No change |
Limited-stop and local perceptions improved, noticed less holding |
Reduced travel time, no change in reliability |
Q17 |
3 min |
Not available |
N/A |
Customers less likely to say buses slow down at green lights |
N/A |
Source: Table 4 in S. Schwarcz, and S. Wyss, “Intermediate Timepoint Removal on Limited-Stop Routes at New York City Transit,” Paper #13-2932 submitted for presentation at the Transportation Research Board 92nd Annual Meeting, Washington, DC, January 2013.
N/A = not available
In addition to the work of Schwarcz and Wyss on this topic, TCRP Synthesis 110: Commonsense Approaches for Improving Transit Bus Speeds25 provides a synthesis of transit practice focused on approaches that transit agencies in North America have taken to realize gains in average bus speeds. Some of these approaches include, but are not limited to, changes that most transit agencies do not have the authority to implement, such as transit signal priority, queue jump lanes, modifications in signal timing, bus-only lanes on arterial streets, and yield-to-bus laws, as well as some simpler approaches, such as locating stops at the far side of a signalized intersection and the near side of an intersection with stop signs.
This memorandum presented an examination of case studies and academic articles in order to identify common service attributes and roadway conditions of existing local-service-only bus routes and corridors that would make it feasible to implement effective limited-stop service. After this phase was completed, the findings were used in Phase 2 to develop a set of criteria for evaluating the potential of existing MBTA local-service-only routes for effective limited-stop bus service, presented in a separate memorandum.26 The results of the third phase of the study were summarized in a third memorandum.27
NH/nh
1 Nicholas Hart, Boston Region Metropolitan Planning Organization staff, memorandum to the Boston Region Metropolitan Planning Organization, July 9, 2015, “Limited-Stop Study, Phase 2: Methodology for Evaluating Limited-Stop Bus Service Potential.”
2 Nicholas Hart, Boston Region Metropolitan Planning Organization staff, memorandum to the Boston Region Metropolitan Planning Organization, July 9, 2015, “Limited-Stop Study, Phase 3: Limited-Stop Service Potential of MBTA Bus Routes.”
3 S. Schwarcz, “Service Design for Heavy Demand Corridors: Limited-Stop Bus Service,” master's thesis, Massachusetts Institute of Technology, 2004.
4 ”Clock-face headways” refers to the scheduling of bus service at regular and evenly spaced intervals, at the same times every hour, such as on the hour, 15 minutes past the hour, and 5 minutes prior to the hour.
5 H. Scorcia, “Design and Evaluation of Bus Rapid Transit and Limited-Stop Services,” master's thesis, Massachusetts Institute of Technology, 2010.
6 A probabilistic choice approach to modeling utilizes a collection of random trip assignments to represent the uncertainty experienced in the real world.
7 A deterministic approach to modeling introduces no randomness into the model.
8 The CTA scheduled headways of 9 to 12 minutes for the local service and 13 minutes for the limited-stop service in the southbound direction in the Ashland corridor.
9 An elasticity is a measurement of how responsive a variable is to a change in another variable.
10 From Table 4-1 and Figure 4-11 in H. Scorcia, “Design and Evaluation of Bus Rapid Transit and Limited-Stop Services,” master's thesis, Massachusetts Institute of Technology, 2010.
11 P. Tétreault, and A. El-Geneidy, “Estimating Bus Run Times for New Limited-Stop Service Using Archived AVL and APC Data,” Transportation Research Part A: Policy and Practice, Vol. 44 (Issue 6), 2010, pp. 390–402.
12 A. El-Geneidy, and J. Surprenant-Legault, “Limited Stop Bus Service: An Evaluation of an Implementation Strategy,” Public Transport: Planning and Operations, Vol. 2 (Issue 4), 2010, pp. 291–306.
13 V. Chiraphadhanakul and C. Barnhart, “Incremental Bus Service Design: Combining Limited-Stop and Local Bus Services,” Public Transport: Planning and Operations, Vol. 5 (Issue 1-2), 2013, pp. 53–78.
14 C. Leiva, J. C. Munoz, R. Giessen, and H. Larrain, “Design of Limited-Stop Services for an Urban Bus Corridor with Capacity Constraints,” Transportation Research Part B: Methodological, Vol. 44 (Issue 10), 2010, pp. 1186–1201.
15 Y. Ulusoy, S. Chien, and C. Wei, “Optimal All-Stop, Short-Turn, and Express Transit Services Under Heterogeneous Demand,” Transportation Research Record, Vol. 2197, 2010, pp. 8–18.
16 N.C. Silverman, “Limited-Stop Bus Service at New York City Transit,” Journal of Transportation Engineering, 1998, pp. 503–509.
17 “Progressive signaling” is a traffic control system in which traffic signals are synchronized along a corridor segment to allow for more efficient traffic flow.
18 A “short-turn” bus trip is a scheduled bus trip that does not extend to the terminus of the route.
19 M. Sholler, “Evaluating Express Bus Service,”master's thesis, Massachusetts Institute of Technology, 2003.
20 A matched headway scenario is a configuration in which limited-stop and local services have identical headways. An unmatched headway scenario is a configuration in which limited-stop and local services have different headways.
21 Sholler measures productivity using three metrics: subsidy per passenger, passengers per vehicle-hour, and passenger-miles.
22 S. Schwarcz, and S. Wyss, “Intermediate Timepoint Removal on Limited-Stop Routes at New York City Transit,” Paper #13-2932 submitted for presentation at the Transportation Research Board 92nd Annual Meeting, Washington, DC, January 2013.
23 Relief points are points on a route where there is a scheduled change in bus operator, usually at the beginning or end of a trip.
24 Buses become “bunched” when the headway is reduced (less than scheduled) between two or more buses operating on a single route. This is generally caused by a bus’s operating behind schedule, ahead of schedule, or both.
25 Transportation Research Board, “Commonsense Approaches for Improving Transit Bus Speeds,” TCRP Synthesis 110, 2013.
26 Nicholas Hart, Boston Region Metropolitan Planning Organization staff, memorandum to the Boston Region Metropolitan Planning Organization, July 9, 2015, “Limited-Stop Study, Phase 2: Methodology for Evaluating Limited-Stop Bus Service Potential.”
27 Nicholas Hart, Boston Region Metropolitan Planning Organization staff, memorandum to the Boston Region Metropolitan Planning Organization, July 9, 2015, “Limited-Stop Study, Phase 3: Limited-Stop Service Potential of MBTA Bus Routes.”