Technical Memorandum
DATE: July 9, 2015
TO: Boston Region Metropolitan Planning Organization
FROM: Nicholas Hart, Transportation Planner
RE: Limited-Stop Study, Phase 2: Methodology for Evaluating
Limited-Stop Bus Service Potential
This memorandum presents the results of the second phase of a three-phase study. The goals of the three-phase study were to develop criteria for evaluating the potential for limited-stop service on bus routes and corridors based on existing and projected ridership demand, operating strategies, roadway characteristics, equipment needs, and costs; to apply these criteria to MBTA Key Bus Routes and other high-ridership routes and corridors; and to make recommendations for prioritizing the limited-stop routes to be implemented, within the constraints of available resources. The first phase of this study was a literature review of strategies for implementing effective limited-stop bus service. 1
The objective of this second phase of the study was to develop a set of evaluation criteria for identifying the existing bus routes and corridors that have potential for successful new limited-stop bus service using a combination of: (1) state-of-the-practice methodologies presented in the literature that was reviewed in the first phase of this study, and (2) new analytical techniques devised by CTPS in consultation with the MBTA. In conjunction with developing evaluation criteria, CTPS staff produced this memorandum so that it can be used as an instruction manual for future application of the criteria by the MBTA or other regional transit authorities to evaluate the potential for limited-stop service along existing bus routes and corridors.
In this memorandum, the guidelines for evaluating an existing bus route or corridor for limited-stop bus service potential are grouped by four metrics:
The following section discusses each of these metrics, including the reasons for using them, the data sources to be used, and the threshold values for rating routes and corridors. For each metric, routes and corridors are rated as strong, medium, or weak candidates for limited-stop service.
High demand along an existing bus route or corridor is essential to running a successful limited-stop bus service. In general, routes and corridors with the highest demand have the most frequent service. In a route or corridor being considered for limited-stop service, demand should ideally be high enough to support combined (local and limited-stop services) headways of five minutes or less, with an upper limit of seven minutes. Limited-stop service with headways greater than 10 minutes may provide little or no net passenger travel-time savings compared with local-stop service if the longer wait times and increased access or egress times offset most or all of the on-board travel-time savings. Therefore, routes and corridors with local headways that are greater than five minutes are not good candidates for limited-stop service if limited-stop trips will replace some of the existing local-stop trips rather than adding to them (in other words, the total number of trips along the route or corridor would not increase), as the result would be headways greater than 10 minutes on the limited-stop and/or local-stop service.
Service frequencies on MBTA bus routes and corridors could be determined from the MBTA’s Route Headway or Operator Headway sheets, which are issued when quarterly service changes are implemented. Other sources of data, such as MBTA Line Statistics reports and timetables produced for the general public, could be used for a preliminary screening, but do not always show the precise headways on routes that have frequent service. In a corridor that is served by two or more routes, the combined headway of all the routes could be used when evaluating the suitability of the corridor for limited-stop service. However, the impacts of increasing the headways on segments not served by all the routes involved must also be considered.
The following thresholds would be used to evaluate routes and corridors as candidates for limited-stop service during the hours of greatest existing service frequency:
Limited-stop service is most effective along routes and corridors that have high percentages of passengers boarding and alighting at a small percentage of stops that are distributed throughout the corridor. For these routes and corridors, limited-stop trips can serve a high percentage of the riders while having only minimal increases in access and egress times for those using the limited-stop trips.
To evaluate the concentration of passenger demand along a route or corridor, the stops are sorted in increasing order of combined boardings and alightings, and plotted as a cumulative demand curve. 2 A steeper curve implies that there is a high concentration of demand, while a shallow curve implies a more dispersed distribution. Routes and corridors with the steepest cumulative demand curves have the greatest potential for limited-stop service. The literature review shows that at least 75 percent of total demand should be concentrated at no more than 25 percent of stops to justify implementing limited-stop service along an existing route or corridor.
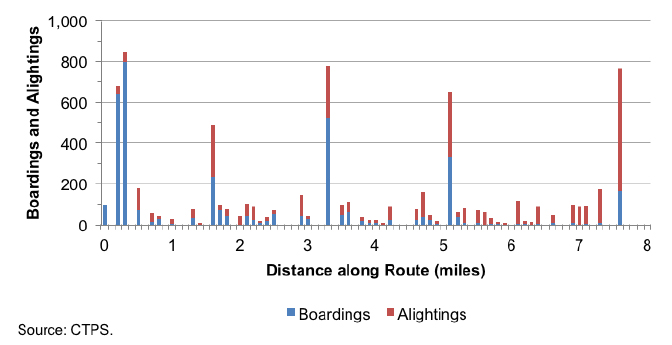
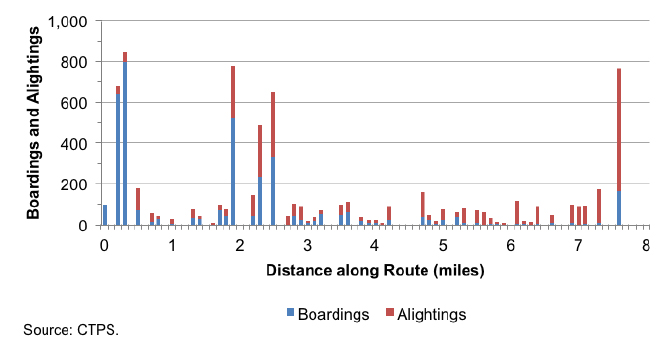
To evaluate the distribution of stops that have high passenger demand, the total demand at each stop is plotted against its distance along the route or corridor. The demand for limited-stop service is likely to be greatest for routes and corridors with the most even distributions of high-demand stops to be served. These routes and corridors have the most opportunities for attracting not only riders who would use the local service, but also others willing and able to walk farther to access or egress limited-stop service in return for faster on-board trips. Figure 1 shows a hypothetical scenario of boardings and alightings for a route that has evenly distributed high-demand stops, which would therefore be considered an ideal candidate for limited-stop service based on this metric. Figure 2 shows a hypothetical scenario of boardings and alightings for a route that has clustered (unevenly distributed) high-demand stops, and which would therefore not be considered an ideal candidate for limited-stop service based on this metric.
FIGURE 1
Hypothetical Route with Evenly Distributed High-Demand Stops
FIGURE 2
Hypothetical Route with Clustered High-Demand Stops
Most MBTA bus routes and corridors have at least one end point that is located at a major transfer point with a rail rapid transit line or with other bus routes. In evaluating such routes and corridors for limited-stop service potential, care must be taken to ensure that there are enough other high-demand stops spread evenly throughout the length of the route or corridor to meet the criteria of this metric.
The MBTA’s automatic passenger counters (APCs) collect boarding and alighting figures by route, trip, and stop on sampled days. The results for the selected groups of routes and time periods could be extracted from the APC databases.
Each route or corridor is evaluated separately for the concentration of passenger demand among stops and for distribution of high-demand stops along the corridor. The concentration of passenger demand along a bus route or corridor is evaluated during each peak period (AM and PM), using the following thresholds:
The distribution of stops with high passenger demand along a route or corridor is evaluated during each peak period, using professional judgment and the following thresholds:
For a limited-stop bus service to be effective, it must achieve a distinct running-time savings over its corresponding local service. To achieve such savings, limited-stop buses must be able to pass local-service buses, turning traffic, and double-parked cars. The ability to do so may be limited by one or both of two factors: (1) the geometry of the roadway, and (2) traffic congestion along the route or corridor. Wide travel lanes and low levels of congestion allow limited-stop buses to maneuver more freely from the curbside lane (right travel lane) into a more free-flowing travel lane.
Roadway geometry information from Massachusetts Department of Transportation (MassDOT) Road Inventory File 3 and traffic speeds from CTPS’s INRIX® database 4 provide the kinds of information needed to evaluate this metric.
For each route or corridor the roadway geometry and traffic congestion are evaluated.
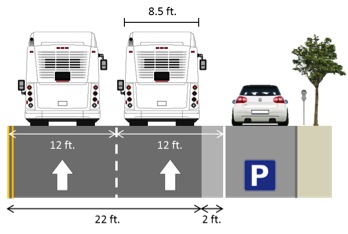
The roadway geometry evaluation is based on a bus maneuverability rating determined by lane width and the presence of on-street parking, with the assumption that buses are 8.5 feet wide. A geometry score is calculated by first multiplying the number of travel lanes in the direction of travel by the average lane width in feet. If there is on-street parking next to a travel lane, the geometry score is reduced by two feet, to allow a buffer between a bus and parked cars, and to compensate for double-parked vehicles. Figure 3 shows a road that has two lanes in the direction of travel, each 12 feet wide, with adjacent on-street parking, producing a geometry score of 22.
FIGURE 3
Example of Roadway Geometry Evaluation
Geometry scores of 18 or less indicate a low maneuverability rating. Scores in this range are applicable to a roadway that has only one lane in the direction of travel or two lanes that are not wide enough to accommodate two buses side by side. Scores between 18 and 27 indicate moderate maneuverability. Scores in this range are generally applicable to a two-lane roadway on which two buses can travel side by side with enough room to operate comfortably, but on which a limited-stop bus might be limited in its opportunity to freely transition from lane to lane because of the presence of other vehicles blocking entry into the free-flowing lane. Scores of 27 or greater indicate a high maneuverability rating. Scores in this range are generally applicable to a roadway that has three or more lanes in the direction of travel, which provides more opportunity for a limited-stop bus to pull out into a free-flowing travel lane. The following thresholds are then applied to a route or corridor to determine the feasibility of limited-stop service based on roadway geometry:
The traffic congestion score for a road segment for a given time interval is the ratio of the average observed traffic speed in that interval to the free-flow speed on that segment. For a limited-stop service evaluation, the 30-minute interval that experiences the heaviest levels of congestion that occurs within the time spans of service for which limited-stop services are being considered is used for the calculation. Congestion scores of 0.85 or higher indicate a low level of congestion. Scores between (but not including) 0.70 and 0.85 indicate moderate congestion. Scores of 0.70 or less indicate a high level of congestion. The following thresholds are used to evaluate a route or corridor to determine limited-stop compatibility based on its level of traffic congestion:
The longer the distance of a passenger trip, the more beneficial limited-stop service is likely to be, since the more time that passengers spend on board limited-stop service, the more travel time they save compared with local service. In general, findings in the literature indicate that limited-stop service is most likely to be effective on a route or corridor with at least 60 percent of passenger trips being longer than two miles, and at least 10 percent of passenger trips being longer than five miles.
Origin-destination flow data provided by the MBTA and the Massachusetts Institute of Technology 5 could be used to determine passenger trip lengths on a bus route. The results from individual routes could be combined to calculate the average trip lengths in a corridor. Many MBTA routes have one-way lengths of less than five miles, which would mean that there are no passenger trips longer than five miles regardless of ridership data availability—those routes would therefore not quality for limited-stop service based on this metric.
The passenger trip length along each route or corridor is evaluated during the period of peak frequency of the bus service on a route or corridor by applying the following thresholds:
The set of criteria that should be used to evaluate the potential for new limited-stop bus service along an existing route or corridor developed in this memo is summarized in Table 1.
TABLE 1
Summary of Evaluation Criteria
| Criteria |
Subfactor |
Score |
Description |
|---|---|---|---|
Service frequency |
N/A |
● Strong Candidate |
Combined headway is less than five minutes |
Service frequency |
N/A |
◒ Medium candidate |
Combined headway is between five minutes and seven minutes |
Service frequency |
N/A |
○ Weak candidate |
Combined headway is greater than seven minutes |
Concentration and distribution of passenger demand |
Concentration of demand |
● Strong Candidate |
More than 75 percent of demand is concentrated within 25 percent of stops along the route or corridor |
Concentration and distribution of passenger demand |
Concentration of demand |
◒ Medium candidate |
Between 65 percent and 75 percent of total demand is concentrated within 25 percent of stops along the route or corridor |
Concentration and distribution of passenger demand |
Concentration of demand |
○ Weak candidate |
Less than 65 percent of total demand is concentrated within 25 percent of stops along the route or corridor |
Concentration and distribution of passenger demand |
Distribution of demand |
● Strong Candidate |
Stops that have high passenger demand are distributed evenly along the route or corridor, with no clustering of high-demand stops |
Concentration and distribution of passenger demand |
Distribution of demand |
◒ Medium candidate |
Stops that have high passenger demand are distributed somewhat evenly along the route or corridor, with low-to-moderate clustering of high-demand stops |
Concentration and distribution of passenger demand |
Distribution of demand |
○ Weak candidate |
Stops that have high passenger demand are heavily clustered around one or two areas along the route or corridor |
Running-time savings potential |
Roadway geometry |
● Strong Candidate |
More than 50 percent of the route or corridor has a high maneuverability rating, and less than 25 percent of the route or corridor has a low maneuverability rating |
Running-time savings potential |
Roadway geometry |
◒ Medium candidate |
75 percent or more of the route or corridor has a moderate-to-high maneuverability rating |
Running-time savings potential |
Roadway geometry |
○ Weak candidate |
Less than 75 percent of the route or corridor has a moderate-to-high maneuverability rating |
Running-time savings potential |
Traffic congestion |
● Strong Candidate |
More than 50 percent of the route or corridor has a low congestion rating, and less than 25 percent of the route or corridor has a high congestion rating |
Running-time savings potential |
Traffic congestion |
◒ Medium candidate |
75 percent or more of the route or corridor has a low-to-moderate congestion rating |
Running-time savings potential |
Traffic congestion |
○ Weak candidate |
Less than 75 percent of the route or corridor has a low-to-moderate congestion rating |
Passenger trip length |
N/A |
● Strong Candidate |
More than 60 percent of passenger trips are longer than two miles, and more than 10 percent of passenger trips are longer than five miles |
Passenger trip length |
N/A |
◒ Medium candidate |
More than 50 percent of passenger trips are longer than two miles |
Passenger trip length |
N/A |
○ Weak candidate |
Less than 50 percent of passenger trips are longer than two miles |
N/A = not applicable
● = strong candidate, ◒ = medium candidate, ○ = weak candidate
Each route and corridor should be analyzed during the time spans of the existing peak-period service, which is determined by a transit agency’s route headway sheets, since limited-stop service is likely to be most effective during those time periods. Most bus routes and corridors that feed rapid transit lines need to be evaluated only for the inbound AM peak period and outbound PM peak period, but crosstown routes and corridors may need to be evaluated in both directions during both peak periods, depending on the amount of demand; the demand may be sufficient to justify two-way limited-stop service in one or both peak periods.
Each selected route and time period should be evaluated using each of the criteria described in Section 2 (the evaluation criteria are shown in Table 1). Routes and corridors are assigned to one of the following three tiers, based on those criteria:
The results of the analysis of MBTA bus routes and corridors are provided in the third Limited-Stop Study memorandum, “Limited-Stop Study, Phase 3: Limited-Stop Service Potential of MBTA Bus Routes.” 6
NH/nh
1 Nicholas Hart, Boston Region Metropolitan Planning Organization staff, memorandum to the Boston Region Metropolitan Planning Organization, July 9, 2015, “Limited-Stop Study, Phase 1: Review of Limited-Stop Bus Service.”
2 For more information on cumulative demand distribution, please refer to the first memorandum of this series: Nicholas Hart, Boston Region Metropolitan Planning Organization staff, memorandum to the Boston Region Metropolitan Planning Organization, July 9, 2015, “Limited-Stop Study, Phase 1: Review of Limited-Stop Bus Service.”
3 Data from MassDOT’s Road Inventory File is not guaranteed to be up-to-date, a factor that should be considered when considering the results of this analysis. For more information, visit http://www.massdot.state.ma.us/planning/Main/MapsDataandReports/Data/GISData/RoadInventory.aspx (accessed: April 21, 2015).
4 INRIX® is a company that specializes in recording traffic data and selling the packaged data. For more information, visit http:// http://www.inrix.com/why-inrix/ (accessed: April 21, 2015).
5 For information on the origin-destination model used for the study, see the journal article (online) by Jason B. Gordon, “Automated Inference of Full Passenger Journeys Using Fare-Transaction and Vehicle-Location Data,” Massachusetts Institute of Technology, 2012, http://hdl.handle.net/1721.1/78242 (accessed April 21, 2015).
6 Nicholas Hart, Boston Region Metropolitan Planning Organization staff, memorandum to the Boston Region Metropolitan Planning Organization, July 9, 2015, “Limited-Stop Study, Phase 3: Limited-Stop Service Potential of MBTA Bus Routes.”