Technical Memorandum
DATE: July 9, 2015
TO: Boston Region Metropolitan Planning Organization
FROM: Nicholas Hart, Transportation Planner
RE: Limited-Stop Study, Phase 3: Limited-Stop Service
Potential of MBTA Bus Routes
This memorandum presents the results of the final phase of a three-phase study of limited-stop bus service. The first phase of this three-phase study was a literature review of strategies for implementing effective limited-stop bus service.1 The second phase was the development of a set of evaluation criteria for identifying existing bus routes and corridors that have potential for effective new limited-stop bus service.2 The objective of this phase was to evaluate the potential of a set of MBTA bus routes and corridors for implementation of limited-stop bus service using the criteria developed in Phase 2.
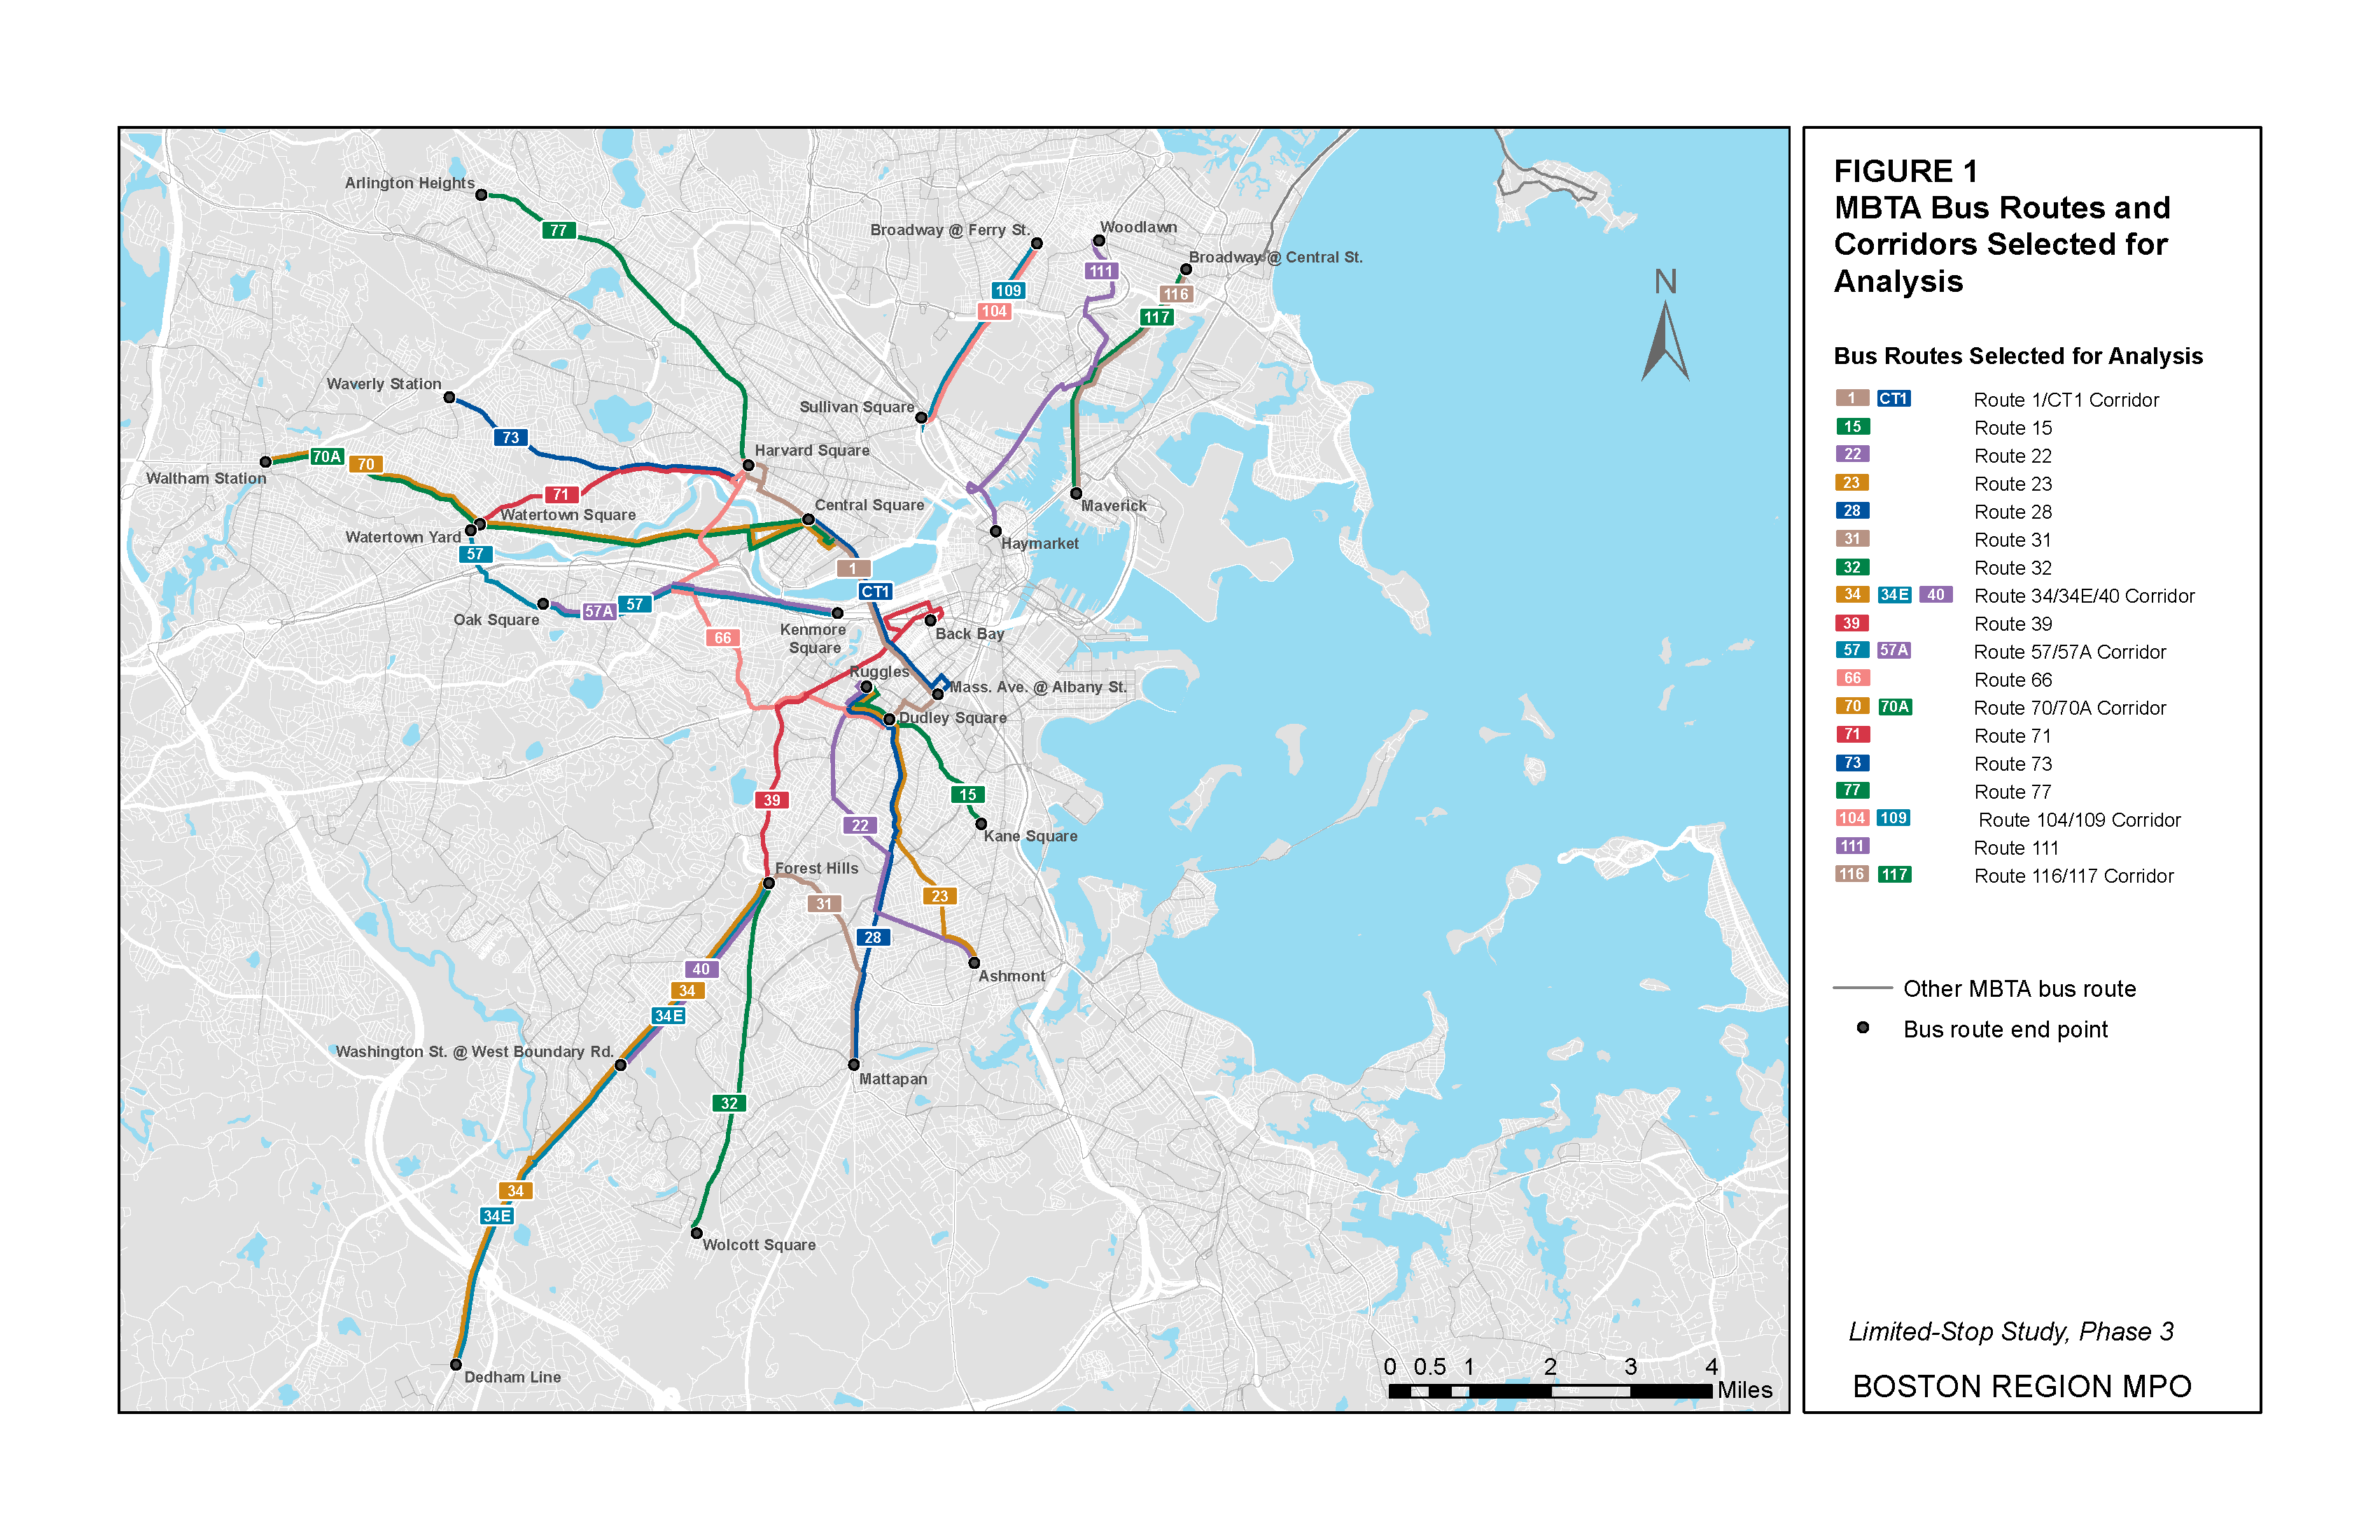
Section 2 of this memorandum presents an evaluation of Route 1/CT1, the MBTA’s only current limited-stop bus service corridor. Section 3 is a summary of evaluations of the potential of limited-stop service of selected local MBTA routes and corridors: bus Routes 15, 22, 23, 28, 31, 32, 39, 66, 77, and 111, trackless trolley Routes 71 and 73, and corridors in which Routes 34/34E/40, 57/57A, 70/70A, 104/109, and 116/117 operate (see Figure 1). These selected routes and corridors include the 15 Key Bus Routes and other high-demand routes and corridors. The evaluations utilized criteria that were developed during the second phase of the study, which were based on the state-of-the-practice methodologies identified in the first phase. Section 3 compares the ratings of the evaluated routes and corridors using each set of criteria, and Section 4 presents the conclusions that staff arrived at based on all three phases of the study. The appendices consist of graphs of the detailed data that were used in the analysis of routes and corridors.
Route CT1 and Route 1 are currently the only pairing of a limited-stop route and a local-stop route in the same corridor in the MBTA bus system. Limited-stop Route CT1 runs between Central Square in Cambridge and the Boston University Medical Center in the South End neighborhood of Boston. Local-stop Route 1 runs between Harvard Square in Cambridge and Dudley Station in Roxbury. These routes overlap between Central Square in Cambridge and Massachusetts Avenue at Harrison Avenue in the South End. Route CT1 was the focus of a 2003 study by Sholler,3 which was summarized in the first phase of this three-phase study of limited-stop bus service. Sholler suggested that passengers along the Route 1/CT1 corridor did not perceive any specific benefits of using one route or the other, and that there was little indication that Route CT1 was providing faster, crosstown service.
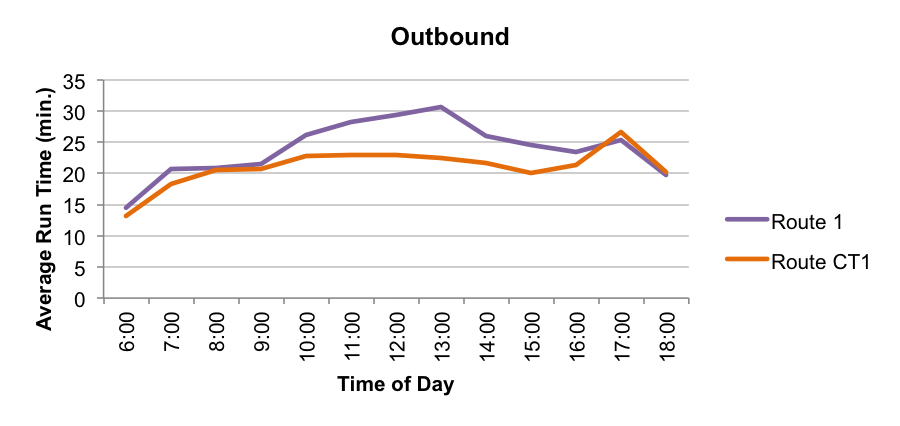
The average running times for Route 1 and Route CT1 by time of day are displayed in Figure 2, and the difference in average running times between Route 1 and Route CT1 is displayed in Figure 3. An analysis of average running times indicates that there is little difference in running-times between Route 1 and Route CT1 in the inbound direction, and minimal travel-time savings for passengers on Route CT1 in the outbound direction. While there are running-time savings for Route CT1 in the outbound direction, savings are at their minimum during the AM peak and PM peak periods, when ridership is at its highest and running-time savings would have their greatest impact on commuters. These average running times suggest that under the current configuration, there is little to no benefit to riders in the Route 1/CT1 corridor of using the limited-stop (CT1) service.
FIGURE 2
Average Running Times: Route 1 and Route CT1
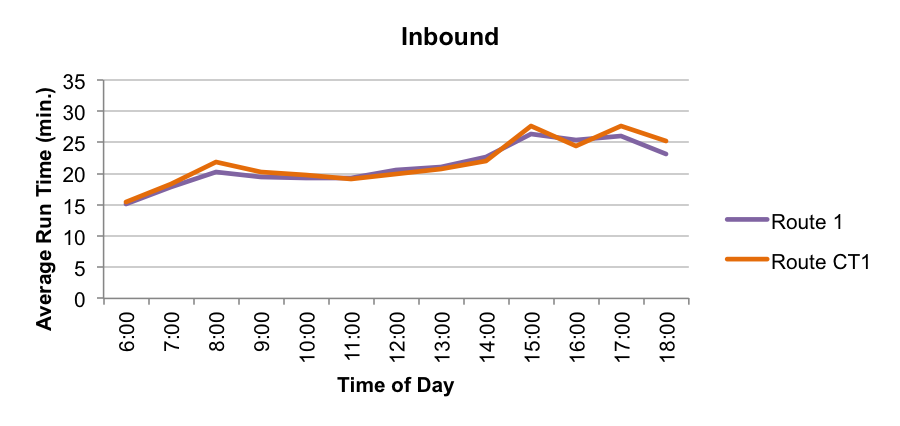
Source: CTPS and MBTA.
Note: The data displayed are for the two-month period between October 1, 2014, and November 30, 2014, for the shared segment of the Route 1/CT1 corridor, between Central Square in Cambridge and Massachusetts Avenue at Washington Street in Roxbury.
FIGURE 3
Average Run-Time Difference between Route 1 and Route CT1
Source: CTPS and MBTA.
Note: The average run-time difference is calculated as the average run time of Route CT1 minus the average run time of Route 1. The data displayed are for the two-month period between October 1, 2014, and November 30, 2014, for the shared segment of the Route 1/CT1 corridor, between Central Square in Cambridge and Massachusetts Avenue at Washington Street in Roxbury.
The remainder of this section presents an evaluation by CTPS of the impact of limited-stop service to riders along the Route 1/CT1 corridor, based on present service frequency, distribution of boardings and alightings, passenger trip lengths, roadway geometry, and traffic congestion. This section concludes with recommendations for improving service along the corridor.
Current service headways for Route CT1 are 20 minutes during the AM and PM peak periods (6:30 to 9:30 AM and 2:50 to 7:20 PM, respectively) and 30 minutes during the midday period (9:30 AM to 2:50 PM). Most of the Route 1 headways are 8 to 10 minutes in the AM peak period, 7 to 8 minutes in the PM peak period, and 15 minutes in the midday period. As summarized in the first memorandum of this project, “Limited-Stop Study, Phase 1: Review of Limited Stop Bus Service” the desired headway for effective limited-stop bus service is 10 minutes or less; Longer headways reduce or eliminate any market for limited-preferred riders because the time-savings accrued on board a limited-stop bus are negated by extra time spent waiting for the bus to arrive. On Route CT1, the headways are two to three times the recommended maximum. Therefore, it is likely that few of the current riders in the Route 1/CT1 corridor choose to use Route CT1 stops and buses if stops served only by Route 1 are closer to their origins and destinations, or when the first bus arriving to pick up passengers at a stop served by both routes is a Route 1 bus.
Figure 4 illustrates the extent to which riders in the Route1/CT1 corridor treat the two routes as a single service. It compares the inbound daily boardings and alightings on each route by distance along the shared segment; Figure 2 does the same for outbound ridership. The data are for the hours (6:30 AM to 7:20 PM) when both routes are in operation on the segment between Central Square in Cambridge and Massachusetts Avenue at Harrison Avenue.
FIGURE 4
Inbound Boardings and Alightings: Route 1 and Route CT1
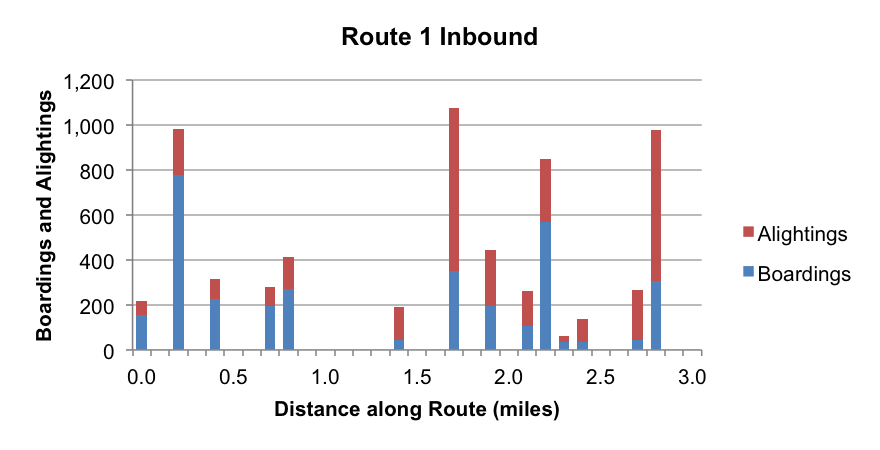
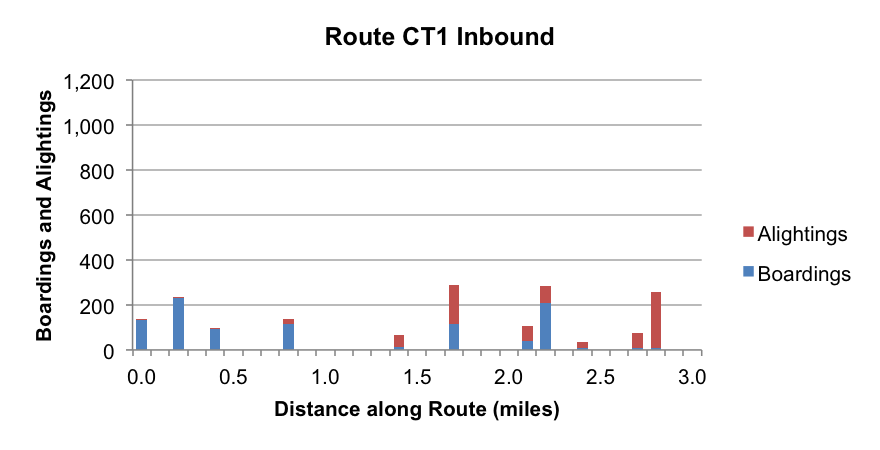
Source: MBTA.
Note: The graphs display data for the shared segment of the Route 1/CT1 corridor, between Central Square in Cambridge and Massachusetts Avenue at Harrison Avenue in Boston.
As shown in Figures 4 and 5, boardings and alightings in both directions are distributed somewhat evenly between the two routes, in proportion to their service frequency (Route 1 has more frequent service). An effective limited-stop service would be more likely than local-stop service to capture a majority of the riders at the high-demand stops and at stops near the ends of the route, where longer-distance passenger trips are more likely to be formed.
FIGURE 5
Outbound Boardings and Alightings: Route 1 and Route CT1
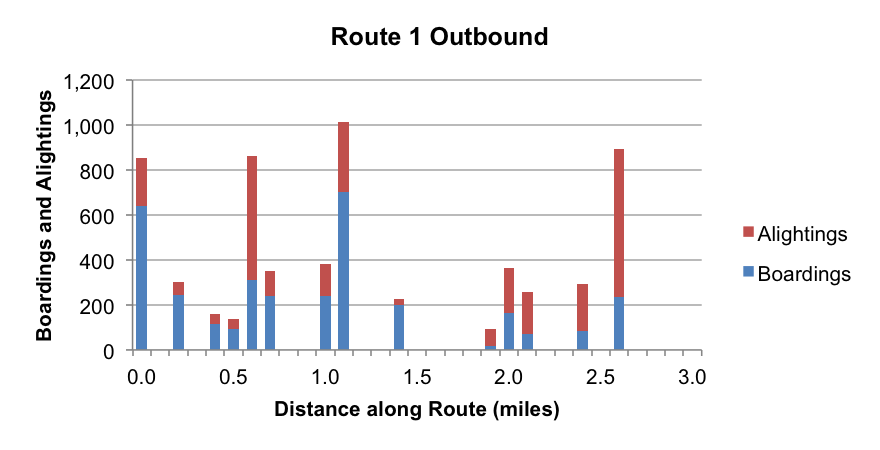
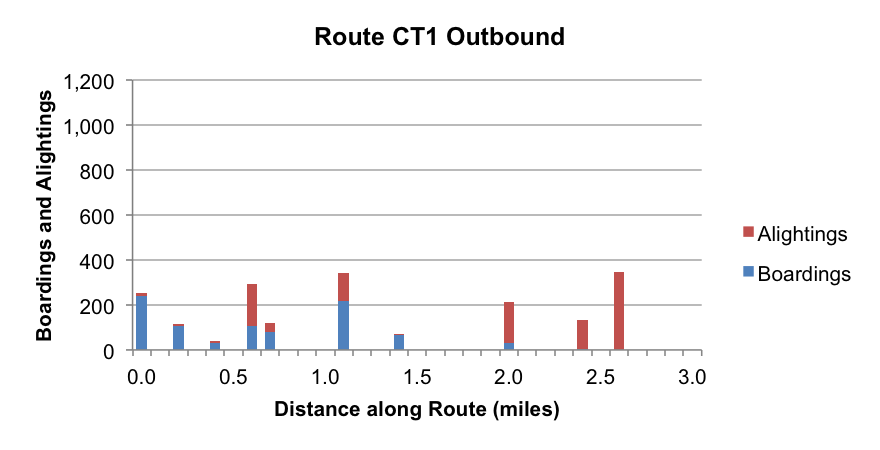
Source: MBTA.
Note: The graphs display data for the shared segment of the Route 1/CT1 corridor, between Massachusetts Avenue at Harrison Avenue in Boston and Central Square in Cambridge.
Figures 4 and 5 also show only small differences between the numbers of stops served by Route 1 and Route CT1. Route CT1 serves 11 of the 14 local-service stops inbound and 10 of the 14 outbound. This constrains the potential travel-time savings of the limited-stop service, offering little incentive for riders to distinguish between Routes 1 and CT1. The literature review suggested that to achieve sufficient travel-time savings, limited-stop buses should only serve about 25 percent of the stops along a corridor, and that the concentration of demand along the corridor should support the selection of stop locations.
Passenger trip lengths also affect the potential for travel-time savings, with the longest trips potentially producing the greatest savings from limited-stop service. Figures 6 and 7 show the distributions of inbound and outbound passenger trip lengths on Routes 1 and CT1. These lengths are derived from origin-destination flow data provided by the MBTA and Massachusetts Institute of Technology.4 They include all of the passenger trips on each route, not just the passenger trips that begin and end within the shared portion of the corridor.
FIGURE 6
Inbound Passenger Trip Lengths: Route 1 and Route CT1
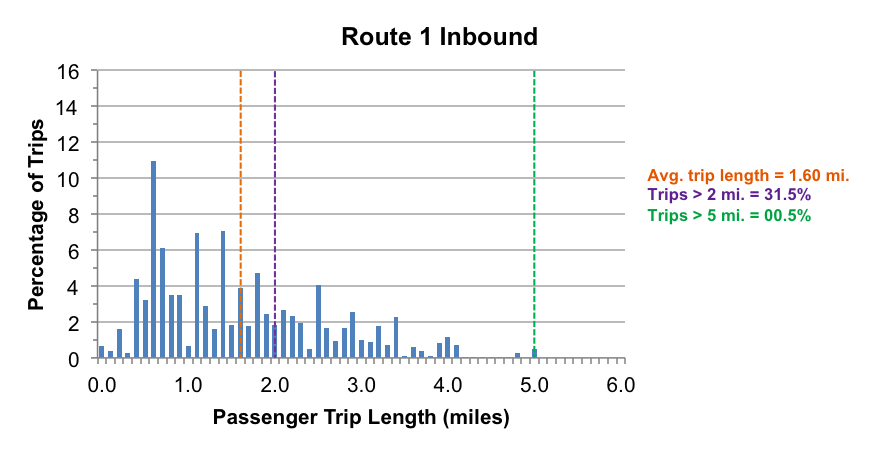
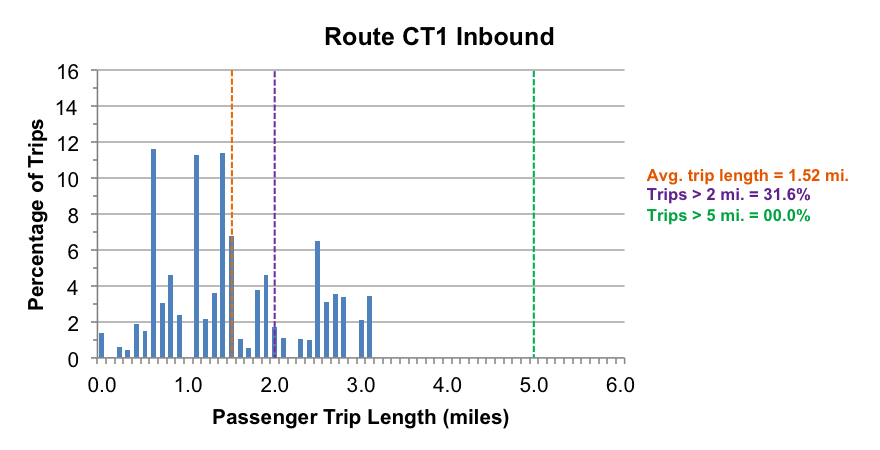
Source: MBTA and MIT.
Note: The passenger trip lengths for each route are calculated for passenger trips on the entire route, not only the shared portion.
FIGURE 7
Outbound Passenger Trip Lengths: Route 1 and Route CT1
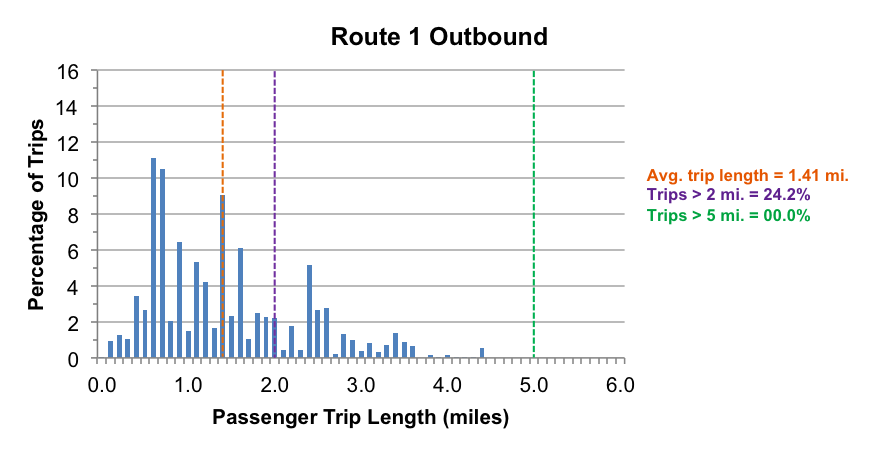
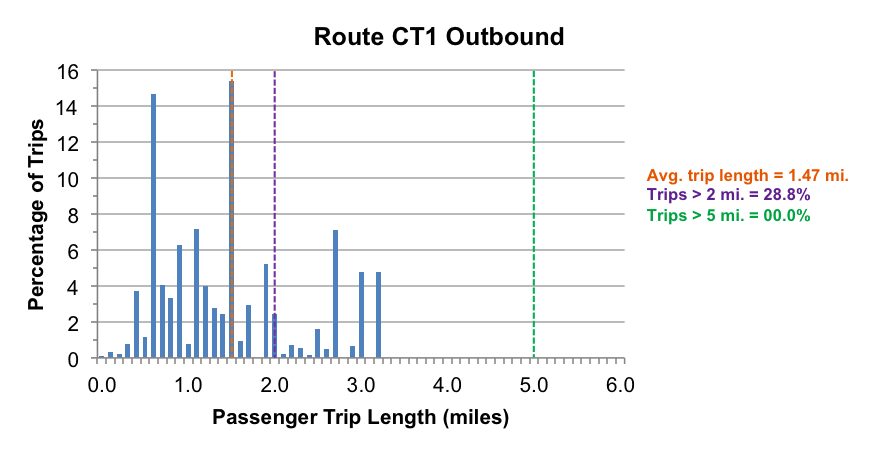
Source: MBTA and MIT.
Note: The passenger trip lengths for each route are calculated for passenger trips on the entire route, not only the shared portion.
The same data source was used for calculating the average inbound and outbound passenger trip lengths for Routes 1 and CT1 (see Table 1). The small differences between the average trip lengths of the two routes further supports the conclusion that passengers in the corridor do not distinguish between the two routes. The literature reviewed suggested that at least 60 percent of passenger trips should be longer than two miles, and at least 10 percent longer than five miles for a limited-stop service to be effective. Trip lengths on Route CT1 do not meet these criteria. Under their current configurations, Route 1 is longer than Route CT1 and therefore has longer possible trip lengths. The literature on limited-stop service indicates that if the local-stop and limited-stop routes in a corridor do not both serve the entire corridor, the local-stop route should be the one covering a shorter distance.
TABLE 1
Passenger Trip Length along the Route 1/CT1 Corridor
Route |
Average Trip Length (miles) |
Percentage of Trips More than 2 miles |
Percentage of Trips More than 5 miles |
|---|---|---|---|
Route 1 Inbound |
1.60 |
31.5% |
0.5% |
Route 1 Outbound |
1.41 |
24.2% |
0.0% |
Route CT1 Inbound |
1.52 |
31.6% |
0.0% |
Route CT1 Outbound |
1.47 |
28.8% |
0.0% |
Source: MBTA and MIT.
The other two criteria that were used in evaluating limited-stop service in the Route 1/CT1 corridor were those pertaining to roadway geometry and traffic congestion.
Figure 8 displays the roadway geometry score for Route 1. This is calculated as the number of travel lanes in the direction of travel multiplied by the average lane width in that direction minus two feet if the segment has on-street parking. This number is the roadway width in which buses must maneuver. The scores for each roadway segment of a route were given one of three maneuverability ratings, based on the amount of space needed for two 8.5-footwide buses to pass each other:
Preferably, for an effective limited-stop service, more than 50 percent of the roadway along the corridor should have a high maneuverability rating, and less than 25 percent should have a low rating. For Route 1 inbound (Harvard Square to Dudley Station), only 1.4 percent of roadway was rated as being high in maneuverability, 61.6 percent received a rating of moderate, and 37.0 percent received a low rating. Outbound, 48.4 percent of roadway was rated high in maneuverability, 51.6 percent was rated moderate, and none was rated low. These rankings suggest that it is difficult for limited-stop buses to maneuver around local buses and other traffic impediments, which limited the ability of the limited-stop service to achieve travel-time savings.
FIGURE 8
Roadway Geometry Scores: Route 1
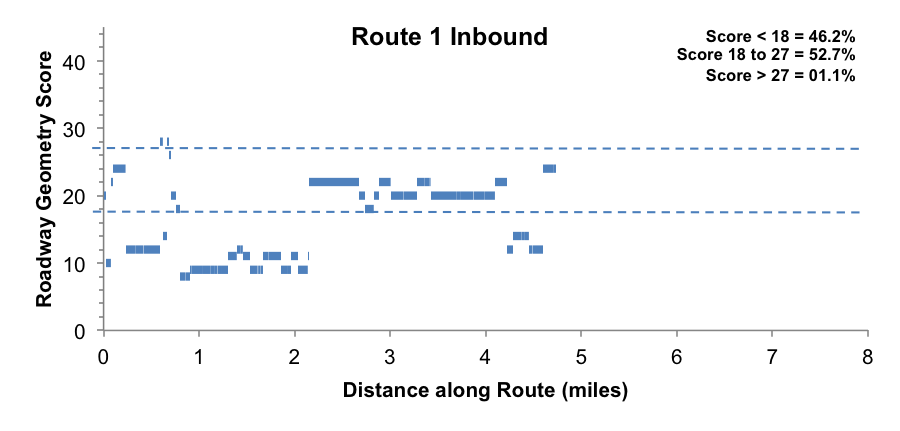
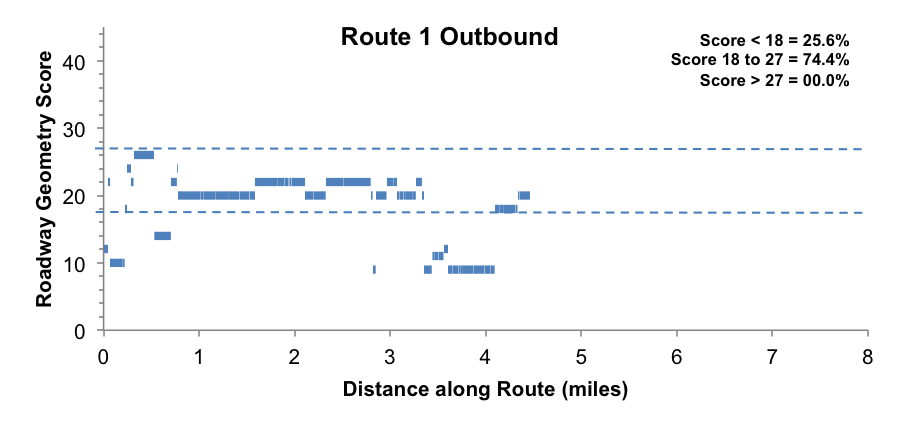
Source: CTPS.
Note: The graphs display data for the entire length of Route 1, from Harvard Square to Dudley Station.
Figure 9 shows traffic congestion levels along Route 1 during the 30-minute interval of greatest congestion on each segment. Congestion is measured as the ratio of the average observed speed in the selected time interval to the average free-flow speed for the same segment. The congestion scores are given one of three ratings:
Preferably, more than 50 percent of roadway along a limited-stop corridor should have a low-congestion rating and less than 25 percent should have a rating of high. In the Route 1 corridor inbound, only 5.2 percent of roadway was rated as having a low level of congestion, 13.7 percent moderate, and 81.1 high. Outbound, none of the roadway was rating as having a low level of congestion, 27.3 percent was rated moderate, and 72.7 percent was rated high. Such high congestion levels further restrict maneuverability, increase running times, and decrease on-time performance.
FIGURE 9
Traffic Congestion: Route 1
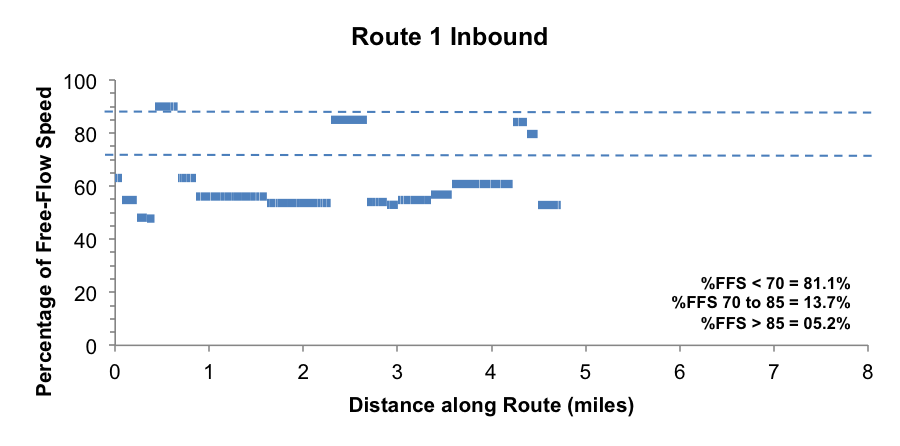
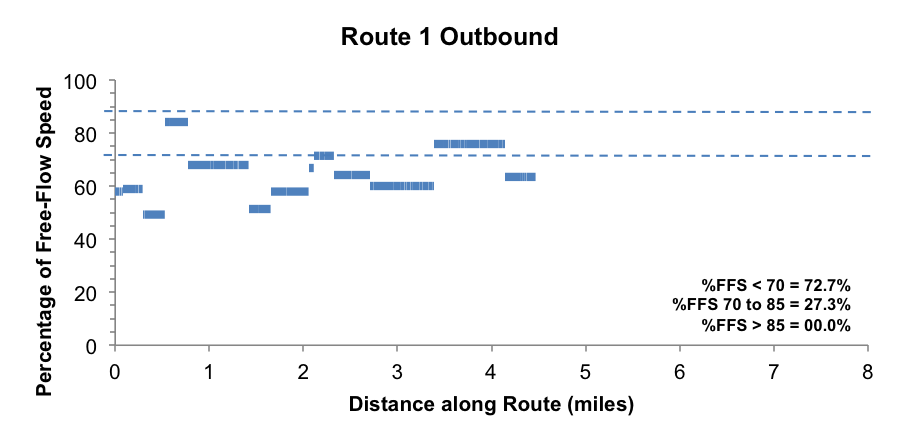
Source: CTPS.
Note: The graphs display data for the entire length of Route 1, from Harvard Square to Dudley Station.
Note: The graphs display data for the entire length of Route 1, from Harvard Square to Dudley Station.
In conclusion, CTPS’s findings are consistent with Sholler’s independent previous findings that passengers along the Route 1/CT1 corridor do not perceive that there is any benefit from using Route CT1 instead of Route 1, and that Route CT1 does not provide faster service.
Operationally, limited-stop service along the Route 1/CT1 corridor could be improved by making the following changes:
Although the above operational adjustments could improve limited-stop service along the Route 1/CT1 corridor, the narrow roadways and high levels of traffic congestion suggest that unless roadway improvements are made to enable greater running-time savings potential, the limited-stop service should be suspended.
The following MBTA bus routes and corridors were evaluated to assess their potential for effective limited-stop service under a resource-neutral implementation strategy. A description of the evaluation criteria developed by CTPS staff in Phase 2 of this study is in the memorandum “Limited-Stop Study, Phase 2: Methodology for Evaluating Limited-Stop Bus Service Potential.”5
The entire Route 15 corridor was studied. It runs between Kane Square in Dorchester and Ruggles Station via Uphams Corner.
The time spans analyzed for this route were 6:25 to 8:33 AM for inbound departures and 3:05 to 5:57 PM for outbound departures. The average headways during these time spans were 5.33 minutes inbound and 7.82 minutes outbound.
The average inbound passenger trip length was 1.11 miles, with 11.8 percent of passenger trips longer than two miles and no passenger trips longer than five miles. The average outbound passenger trip length was 1.11 miles, with 14.1 percent of passenger trips longer than two miles and no passenger trips longer than five miles.
About 60 percent of the inbound passenger demand was concentrated within 25 percent of stops, as was about 63 percent of the outbound demand. In both directions, stops with high demand were distributed fairly evenly along the route, with no major clustering.
Maneuverability was rated high on 44.4 percent of the route in the inbound direction and 30.1 percent in the outbound direction, and moderate on 55.6 percent inbound and 69.9 percent outbound. No segments of the route in either direction were rated low in maneuverability.
No segments of the route in either direction were rated low in congestion. Congestion was rated moderate on 26.8 percent of the route in the inbound direction and 19.3 percent in the outbound direction, and high on 73.2 percent inbound and 80.7 percent outbound.
The evaluation of Route 15 is summarized in Table 2.
TABLE 2
Summary of Route 15 Evaluation
Direction |
Time Period |
Service Frequency |
Trip Length |
Concentration of Demand |
Distribution of Demand |
Roadway Geometry |
Traffic Congestion |
|---|---|---|---|---|---|---|---|
Inbound |
6:25 AM – 8:33 AM |
◒ Medium Candidate |
○ Weak Candidate |
○ Weak Candidate |
◒ Medium Candidate |
◒ Medium Candidate |
○ Weak Candidate |
Outbound |
3:05 PM – 5:57 PM |
○ Weak Candidate |
○ Weak Candidate |
○ Weak Candidate |
◒ Medium Candidate |
◒ Medium Candidate |
○ Weak Candidate |
● = strong candidate, ◒ = medium candidate, ○ = weak candidate
The entire Route 22 corridor was studied. It runs between Ashmont Station and Ruggles Station via Talbot Avenue and Jackson Square.
The time spans analyzed for this route were 6:00 to 8:59 AM for inbound departures and 4:10 to 5:58 PM for outbound departures. The average headways during these time spans were 7.16 minutes inbound and 8.31 minutes outbound.
The average inbound passenger trip length was 1.88 miles, with 40.1 percent of passenger trips longer than two miles and 0.7 percent longer than five miles. The average outbound passenger trip length was 1.77 miles, with 36.1 percent of passenger trips longer than two miles and none longer than five miles.
About 57 percent of the inbound passenger demand was concentrated within 25 percent of the stops, as was about 55 percent of the outbound demand. In both directions, stops with high demand were distributed fairly evenly along the route, with no major clustering.
Maneuverability was rated high on 73.5 percent of the route in the inbound direction and 60.9 percent in the outbound direction, and moderate on 26.5 percent inbound and 39.1 percent outbound. No segments of the route in either direction were rated low in maneuverability.
No segments of the route in either direction were rated low in congestion. However, congestion was rated moderate on 29.4 percent of the route in the inbound direction and 61.4 percent in the outbound direction, and high on 70.6 percent inbound and 38.6 percent outbound.
The evaluation of Route 22 is summarized in Table 3.
TABLE 3
Summary of Route 22 Evaluation
Direction |
Time Period |
Service Frequency |
Trip Length |
Concentration of Demand |
Distribution of Demand |
Roadway Geometry |
Traffic Congestion |
|---|---|---|---|---|---|---|---|
Inbound |
6:00 AM – 8:59 AM |
○ Weak Candidate |
○ Weak Candidate |
○ Weak Candidate |
◒ Medium Candidate |
● Strong Candidate |
○ Weak Candidate |
Outbound |
4:10 PM – 5:58 PM |
○ Weak Candidate |
○ Weak Candidate |
○ Weak Candidate |
◒ Medium Candidate |
● Strong Candidate |
○ Weak Candidate |
● = strong candidate, ◒ = medium candidate, ○ = weak candidate
The entire Route 23 corridor was studied. It runs between Ashmont Station and Ruggles Station via Washington Street.
The time spans analyzed for this route were 6:05 to 9:01 AM for inbound departures and 3:33 to 6:56 PM for outbound departures. The average headways during these time spans were 5.18 minutes inbound and 7.25 minutes outbound.
The average inbound passenger trip length was 1.62 miles, with 32.6 percent of passenger trips longer than two miles and no trips longer than five miles. The average outbound passenger trip length was 1.55 miles, with 29.5 percent of passenger trips longer than two miles and no trips longer than five miles.
About 62 percent of the inbound passenger demand was concentrated within 25 percent of stops, as was about 60 percent of the outbound demand. In both directions, stops with high demand were distributed fairly evenly along the route, with some moderate clustering.
Maneuverability was rated high on 85.0 percent of the route in the inbound direction and 71.9 percent in the outbound direction, and moderate on 15.0 percent inbound and 19.9 percent outbound. However, while a low level of maneuverability was not found on any segments of the route in the inbound direction, it was found on 8.2 percent of the route in the outbound direction.
No segments of the route in either direction were rated low in congestion. Congestion was rated moderate on 52.8 percent of the route in the inbound direction and 17.2 percent in the outbound direction, and high on 47.2 percent inbound and 82.8 percent outbound.
The evaluation of Route 23 is summarized in Table 4.
TABLE 4
Summary of Route 23 Evaluation
Direction |
Time Period |
Service Frequency |
Trip Length |
Concentration of Demand |
Distribution of Demand |
Roadway Geometry |
Traffic Congestion |
|---|---|---|---|---|---|---|---|
Inbound |
6:05 AM – 9:01 AM |
◒ Medium Candidate |
○ Weak Candidate |
○ Weak Candidate |
◒ Medium Candidate |
● Strong Candidate |
○ Weak Candidate |
Outbound |
3:33 PM – 6:56 PM |
○ Weak Candidate |
○ Weak Candidate |
○ Weak Candidate |
◒ Medium Candidate |
● Strong Candidate |
○ Weak Candidate |
● = strong candidate, ◒ = medium candidate, ○ = weak candidate
The entire Route 28 corridor was studied. It runs between Mattapan Station and Ruggles Station via Dudley Station.
The time spans analyzed for this route were 6:02 to 9:01 AM for inbound departures and 3:00 to 7:03 PM for outbound departures. The average headways during these time spans were 6.63 minutes inbound and 8.38 minutes outbound.
The average inbound passenger trip length was 1.92 miles, with 46.8 percent of passenger trips longer than two miles, and 1.3 percent longer than five miles. The average outbound passenger trip length was 1.94 miles, with 40.9 percent of passenger trips longer than two miles and 2.6 percent longer than five miles.
About 55 percent of the passenger demand in each direction was concentrated within 25 percent of stops. However, ridership in both directions was heavily concentrated at Ruggles Station and Dudley Station, with no other high- demand stops on the route.
Maneuverability was rated high on 66.4 percent of the route in the inbound direction and 56.8 percent in the outbound direction, and moderate on 33.6 percent inbound and 33.1 percent outbound. A low level of maneuverability was not found on any segments of the route inbound, but was found on 10.1 percent of the route in the outbound direction.
No segments of the route in either direction were rated low in congestion. Congestion was rated moderate on 36.3 percent of the route in the inbound direction and 15.5 percent in the outbound direction, and high on 63.7 percent inbound and 84.5 percent outbound.
The evaluation of Route 28 is summarized in Table 5.
TABLE 5
Summary of Route 28 Evaluation
Direction |
Time Period |
Service Frequency |
Trip Length |
Concentration of Demand |
Distribution of Demand |
Roadway Geometry |
Traffic Congestion |
|---|---|---|---|---|---|---|---|
Inbound |
6:02 AM – 9:01 AM |
◒ Medium Candidate |
○ Weak Candidate |
○ Weak Candidate |
○ Weak Candidate |
● Strong Candidate |
○ Weak Candidate |
Outbound |
3:00 PM – 7:03 PM |
○ Weak Candidate |
○ Weak Candidate |
○ Weak Candidate |
○ Weak Candidate |
● Strong Candidate |
○ Weak Candidate |
● = strong candidate, ◒ = medium candidate, ○ = weak candidate
The entire Route 31 corridor was studied. It runs between Mattapan Station and Forest Hills Station via Morton Street
The time spans analyzed for this route were 5:55 to 9:00 AM for inbound departures and 3:00 to 6:00 PM for outbound departures. The average headways during these time spans were 4.87 minutes inbound and 4.86 minutes outbound.
The average inbound passenger trip length was 1.18 miles, with 17.6 percent of passenger trips longer than two miles and no trips longer than five miles. The average outbound passenger trip length was 1.25 miles, with 21.7 percent of passenger trips longer than two miles and no trips longer than five miles.
About 65 percent of the inbound passenger demand was concentrated within 25 percent of stops, as was about 66 percent of the outbound demand was. However, ridership in both directions was heavily concentrated at Forest Hills Station, with no other high-demand stops on the route.
Maneuverability was rated high on 10.2 percent of the route in the inbound direction and 27.5 percent of the route in the outbound direction, and moderate on 89.8 percent inbound and 72.5 percent outbound. No segments of the route in either direction were rated low in maneuverability.
No segments of the route in either direction were rated low in congestion. Congestion was rated moderate on 78.6 percent of the route in the inbound direction and 28.7 percent in the outbound direction, and high on 21.4 percent inbound and 71.3 percent outbound.
The evaluation of Route 31 is summarized in Table 6.
TABLE 6
Summary of Route 31 Evaluation
Direction |
Time Period |
Service Frequency |
Trip Length |
Concentration of Demand |
Distribution of Demand |
Roadway Geometry |
Traffic Congestion |
|---|---|---|---|---|---|---|---|
Inbound |
5:55 AM – 9:00 AM |
● Strong Candidate |
○ Weak Candidate |
◒ Medium Candidate |
○ Weak Candidate |
◒ Medium Candidate |
◒ Medium Candidate |
Outbound |
3:00 PM – 6:00 PM |
● Strong Candidate |
○ Weak Candidate |
◒ Medium Candidate |
○ Weak Candidate |
◒ Medium Candidate |
○ Weak Candidate |
● = strong candidate, ◒ = medium candidate, ○ = weak candidate
The entire Route 32 corridor was studied. It runs between Wolcott Square and Forest Hills Station via Hyde Park Avenue.
The time spans analyzed for this route were 5:30 to 9:16 AM for inbound departures and 3:00 to 6:52 PM for outbound departures. The average headways during these time spans were 3.42 minutes inbound and 3.80 minutes outbound.
The average inbound passenger trip length was 1.53 miles, with 28.5 percent of passenger trips longer than two miles and no trips longer than five miles. The average outbound passenger trip length was 1.54 miles, with 27.7 percent of passenger trips longer than two miles and no trips longer than five miles.
About 74 percent of the inbound passenger demand was concentrated within 25 percent of stops, as was about 72 percent of the outbound demand. However, ridership in both directions was heavily concentrated at Forest Hills Station, with no other high-demand stops on the route.
Maneuverability was rated high on 60.0 percent of the route in the inbound direction and 60.1 percent in the outbound direction, and moderate on 40.0 percent inbound and 39.9 percent outbound. No segments of the route in either direction were rated low in maneuverability.
A low level of congestion was not found on any segments of the route in the inbound direction, but was found on 29.9 percent of the route in the outbound direction. Moderate congestion was found on 30.6 percent in the inbound direction and 54.3 percent outbound. Congestion was rated high on 69.4 percent inbound and 15.9 percent outbound.
The evaluation of Route 32 is summarized in Table 7.
TABLE 7
Summary of Route 32 Evaluation
Direction |
Time Period |
Service Frequency |
Trip Length |
Concentration of Demand |
Distribution of Demand |
Roadway Geometry |
Traffic Congestion |
|---|---|---|---|---|---|---|---|
Inbound |
5:30 AM – 9:16 AM |
● Strong Candidate |
○ Weak Candidate |
◒ Medium Candidate |
○ Weak Candidate |
● Strong Candidate |
○ Weak Candidate |
Outbound |
3:00 PM – 6:52 PM |
● Strong Candidate |
○ Weak Candidate |
◒ Medium Candidate |
○ Weak Candidate |
● Strong Candidate |
◒ Medium Candidate |
● = strong candidate, ◒ = medium candidate, ○ = weak candidate
The entire Route 34/34E/40 corridor was studied. It runs between the Dedham Line and Forest Hills Station via Washington Street.
The time spans analyzed for this corridor were 6:09 to 9:01 AM for inbound departures and 3:00 to 6:15 PM for outbound departures. The average combined headways during these time spans were 4.91 minutes inbound and 5.42 minutes outbound.
The average inbound passenger trip length was 2.11 miles, with 48.7 percent of passenger trips longer than two miles and no trips longer than five miles. The average outbound passenger trip length was 2.05 miles, with 45.8 percent of passenger trips longer than two miles and no trips longer than five miles.
About 70 percent of the passenger demand in each direction was concentrated within 25 percent of stops. However, ridership in both directions was heavily concentrated at Forest Hills Station, with no other high-demand stops on the corridor.
Maneuverability was rated high found on 6.9 percent of the route in the inbound direction and 5.7 percent in the outbound direction, and moderate on 93.1 percent inbound and 94.3 percent outbound. No segments of the route in either direction were rated low in maneuverability.
No segments of the route in either direction were rated low in congestion. Congestion was not rated moderate on any segments of the route in the inbound direction, but it was rated moderate on 19.8 percent in the outbound direction. It was rated high on 100 percent of the route in the inbound direction and 80.2 percent in the outbound direction.
The evaluation of the Route 34/34E/40 corridor is summarized in Table 8.
TABLE 8
Summary of Route 34/34E/40 Corridor Evaluation
Direction |
Time Period |
Service Frequency |
Trip Length |
Concentration of Demand |
Distribution of Demand |
Roadway Geometry |
Traffic Congestion |
|---|---|---|---|---|---|---|---|
Inbound |
6:09 AM – 9:01 AM |
● Strong Candidate |
○ Weak Candidate |
◒ Medium Candidate |
○ Weak Candidate |
◒ Medium Candidate |
○ Weak Candidate |
Outbound |
3:00 PM – 6:15 PM |
◒ Medium Candidate |
○ Weak Candidate |
◒ Medium Candidate |
○ Weak Candidate |
◒ Medium Candidate |
○ Weak Candidate |
● = strong candidate, ◒ = medium candidate, ○ = weak candidate
The entire Route 39 corridor was studied. It runs between Forest Hills Station and Back Bay Station via Huntington Avenue.
The time spans analyzed for this route were 6:05 to 9:25 AM for inbound departures and 4:10 to 6:56 PM for outbound departures. The average headway during these time spans was 5.13 minutes inbound and 6.38 minutes outbound.
The average inbound passenger trip length was 1.89 miles, with 52.3 percent of passenger trips longer than two miles and 1.0 percent longer than five miles. The average outbound passenger trip length was 1.67 miles, with 33.3 percent of passenger trips longer than two miles and 0.5 percent longer than five miles.
About 57 percent of the inbound passenger demand was concentrated within 25 percent of stops, as was about 52 percent of the outbound demand. In both directions, stops with high demand were distributed fairly evenly along the route, with some moderate clustering.
Maneuverability was rated high on 22.1 percent of the route in the inbound direction and 12.2 percent of the route in the outbound direction, and moderate on 77.9 percent inbound and 84.5 percent outbound. A low level of maneuverability was not found on any segments of the route in the inbound direction, but was found on 3.4 percent of the route in the outbound direction.
No segments of the route in either direction were rated low in congestion. Congestion was rated moderate on 37.6 percent of the route in the inbound direction and 33.9 percent in the outbound direction, It was rated high on 62.4 percent inbound and 66.1 percent outbound.
The evaluation of Route 39 is summarized in Table 9.
TABLE 9
Summary of Route 39 Evaluation
Direction |
Time Period |
Service Frequency |
Trip Length |
Concentration of Demand |
Distribution of Demand |
Roadway Geometry |
Traffic Congestion |
|---|---|---|---|---|---|---|---|
Inbound |
6:05 AM – 9:25 AM |
◒ Medium Candidate |
◒ Medium Candidate |
○ Weak Candidate |
◒ Medium Candidate |
◒ Medium Candidate |
○ Weak Candidate |
Outbound |
4:10 PM – 6:56 PM |
◒ Medium Candidate |
○ Weak Candidate |
○ Weak Candidate |
◒ Medium Candidate |
◒ Medium Candidate |
○ Weak Candidate |
● = strong candidate, ◒ = medium candidate, ○ = weak candidate
The entire Route 57/57A corridor was studied. It runs between Watertown Yard and Kenmore Station via Newton Corner and Brighton Center.
The time spans analyzed for this corridor were 6:32 to 9:04 AM for inbound departures and 4:00 to 6:31 PM for outbound departures. The average combined headways during these time spans were 5.43 minutes inbound and 5.64 minutes outbound.
The average inbound passenger trip length was 1.87 miles, with 38.7 percent of passenger trips longer than two miles and 1.6 percent longer than five miles. The average outbound passenger trip length was 1.73 miles, with 34.8 percent of passenger trips longer than two miles and 0.6 percent longer than five miles.
About 65 percent of the inbound passenger demand was concentrated within 25 percent of stops, as was about 62 percent of the outbound demand. However, ridership in both directions was heavily concentrated at Kenmore Station, with only a few high-demand stops elsewhere on the corridor.
Maneuverability was rated high found on 20.8 percent of the route in the inbound direction and 16.6 percent in the outbound direction, and moderate on 79.2 percent in the inbound direction and 83.4 percent in the outbound direction. No segments of the route in either direction were rated low in maneuverability.
A low level of congestion was not found on any segments of the route in the inbound direction, but was found on 19.6 percent in the outbound direction. Congestion was rated moderate on 53.9 percent of the route in the inbound direction and 34.2 percent outbound, and high on 46.1 percent inbound and 46.2 percent outbound.
The evaluation of Route 57/57A corridor is summarized in Table 10.
TABLE 10
Summary of Route 57/57A Corridor Evaluation
Direction |
Time Period |
Service Frequency |
Trip Length |
Concentration of Demand |
Distribution of Demand |
Roadway Geometry |
Traffic Congestion |
|---|---|---|---|---|---|---|---|
Inbound |
6:32 AM – 9:04 AM |
◒ Medium Candidate |
○ Weak Candidate |
◒ Medium Candidate |
○ Weak Candidate |
◒ Medium Candidate |
○ Weak Candidate |
Outbound |
4:00 PM – 6:21 PM |
◒ Medium Candidate |
○ Weak Candidate |
○ Weak Candidate |
○ Weak Candidate |
◒ Medium Candidate |
○ Weak Candidate |
● = strong candidate, ◒ = medium candidate, ○ = weak candidate
The entire Route 66 corridor was studied. It runs between Harvard Square and Dudley Station via Allston and Brookline Village.
The time spans analyzed for this route were 6:00 to 9:17 AM for inbound departures and 3:30 to 7:08 PM for outbound departures. The average headway during these time spans was 8.21 minutes inbound and 9.48 minutes outbound.
The average inbound passenger trip length was 2.09 miles, with 45.6 percent of passenger trips longer than two miles and 2.6 percent longer than five miles. The average outbound passenger trip length was 2.08 miles, with 45.3 percent of passenger trips longer than two miles and 2.3 percent longer than five miles.
About 57 percent of the inbound passenger demand was concentrated within 25 percent of stops, as was about 56 percent of the outbound demand. In both directions, stops with high demand were distributed evenly along the route, with no clustering.
Maneuverability was rated high on 63.0 percent of the route in the inbound direction and 60.8 percent in the outbound direction, and moderate on 37.0 percent inbound and 39.2 percent outbound. No segments of the route in either direction were rated low in maneuverability.
Congestion was not rated low on any segments of the route in the inbound direction, but was rated low on 12.5 percent of the route in the outbound direction. It was rated moderate on 53.2 percent inbound and 31.9 percent outbound, and high on 46.8 percent inbound and 55.6 percent outbound.
The evaluation of Route 66 is summarized in Table 11.
TABLE 11
Summary of Route 66 Evaluation
Direction |
Time Period |
Service Frequency |
Trip Length |
Concentration of Demand |
Distribution of Demand |
Roadway Geometry |
Traffic Congestion |
|---|---|---|---|---|---|---|---|
Inbound |
6:00 AM – 9:17 AM |
○ Weak Candidate |
○ Weak Candidate |
○ Weak Candidate |
● Strong Candidate |
● Strong Candidate |
○ Weak Candidate |
Outbound |
3:30 PM – 7:08 PM |
○ Weak Candidate |
○ Weak Candidate |
○ Weak Candidate |
● Strong Candidate |
● Strong Candidate |
○ Weak Candidate |
● = strong candidate, ◒ = medium candidate, ○ = weak candidate
The portion of the Route 70/70A corridor that was studied runs between the Waltham commuter rail station and Central Square in Cambridge via Arsenal Street and Western Avenue.
The time spans analyzed for this corridor were 6:20 to 8:10 AM for inbound departures and 3:00 to 6:25 PM for outbound departures. The average combined headways during these time spans were 9.15 minutes inbound and 9.76 minutes outbound.
The average inbound passenger trip length was 4.09 miles, with 77.9 percent of passenger trips longer than two miles and 37.1 percent longer than five miles. The average outbound passenger trip length was 3.40 miles, with 67.1 percent of passenger trips longer than two miles and 24.9 percent longer than five miles.
About 73 percent of the inbound passenger demand was concentrated within 25 percent of stops, as was about 75 percent of the outbound demand. However, ridership in both directions was heavily concentrated at Central Square, with only a few high-demand stops elsewhere along the corridor.
Maneuverability was rated high on 70.5 percent of the route in the inbound direction and 70.9 percent in the outbound direction, and moderate on 29.5 percent inbound and 29.1 percent outbound. No segments of the route in either direction were rated low in maneuverability.
Congestion was rated low on 22.6 percent of the route in the inbound direction and 2.0 percent in the outbound direction, moderate on 35.7 percent inbound and 66.2 percent outbound, and high on 41.7 percent inbound and 31.8 percent outbound.
The evaluation of Route 70/70A corridor is summarized in Table 12.
TABLE 12
Summary of Route 70/70A Corridor Evaluation
Direction |
Time Period |
Service Frequency |
Trip Length |
Concentration of Demand |
Distribution of Demand |
Roadway Geometry |
Traffic Congestion |
|---|---|---|---|---|---|---|---|
Inbound |
6:20 AM – 8:10 AM |
○ Weak Candidate |
● Strong Candidate |
○ Weak Candidate |
◒ Medium Candidate |
● Strong Candidate |
○ Weak Candidate |
Outbound |
3:00 PM – 6:25 PM |
○ Weak Candidate |
● Strong Candidate |
◒ Medium Candidate |
◒ Medium Candidate |
● Strong Candidate |
○ Weak Candidate |
● = strong candidate, ◒ = medium candidate, ○ = weak candidate
The entire trackless trolley Route 71 was studied.6 To implement limited-stop service on this route, buses would have to supplement the trackless trolleys in order to maneuver around local-stop service. The time spans analyzed for this route were 6:06 to 9:15 AM for inbound departures and 3:10 to 7:00 PM for outbound departures. The average headways during these time spans were 7.00 minutes inbound and 8.85 minutes outbound.
The average inbound passenger trip length was 1.42 miles, with 26.8 percent of passenger trips longer than two miles. The average outbound passenger trip length was 1.12 miles, with 14.8 percent of passenger trips longer than two miles. No trips in either direction were longer than five miles.
About 67 percent of the inbound passenger demand was concentrated within 25 percent of stops, as was about 68 percent of the outbound demand. However, ridership in both directions was heavily concentrated at Harvard Square, with only a few high-demand stops elsewhere along the route.
Maneuverability was rated high found on 86.2 percent of the route in the inbound direction and 83.8 percent in the outbound direction, and moderate on 13.8 percent inbound and 16.2 percent outbound. No segments of the route in either direction were rated low in maneuverability.
Congestion was rated low on 80.4 percent of the route in the inbound direction and 56.5 percent in the outbound direction, moderate on 5.1 percent inbound and 42.0 percent outbound, and high on 14.6 percent inbound and 1.5 percent outbound.
The evaluation of Route 71 is summarized in Table 13.
TABLE 13
Summary of Route 71 Evaluation
Direction |
Time Period |
Service Frequency |
Trip Length |
Concentration of Demand |
Distribution of Demand |
Roadway Geometry |
Traffic Congestion |
|---|---|---|---|---|---|---|---|
Inbound |
6:06 AM – 9:15 AM |
◒ Medium Candidate |
○ Weak Candidate |
◒ Medium Candidate |
○ Weak Candidate |
● Strong Candidate |
● Strong Candidate |
Outbound |
3:10 PM – 7:00 PM |
○ Weak Candidate |
○ Weak Candidate |
◒ Medium Candidate |
○ Weak Candidate |
● Strong Candidate |
● Strong Candidate |
● = strong candidate, ◒ = medium candidate, ○ = weak candidate
The entire trackless trolley Route 73 was studied.7 To implement limited-stop service on this route, buses would have to supplement the trackless trolleys in order to maneuver around local-stop service. The time spans analyzed for this route were 6:45 to 9:30 AM for inbound departures and 3:33 to 7:20 PM for outbound departures. The average headways during these time spans were 5.69 minutes inbound and 5.04 minutes outbound.
The average inbound passenger trip length was 1.40 miles, with 26.5 percent of passenger trips longer than two miles and no trips longer than five miles. The average outbound passenger trip length was 0.99 miles, with 10.5 percent of passenger trips longer than two miles and no trips longer than five miles.
About 72 percent of the inbound passenger demand was concentrated within 25 percent of stops, as was about 63 percent of the outbound demand. However, ridership in both directions was heavily concentrated at Harvard Square, with only a few high-demand stops elsewhere along the route.
Maneuverability was rated high on 68.4 percent of the route in the inbound direction and 65.8 percent in the outbound direction, and moderate on 31.6 percent inbound and 34.2 percent outbound. No segments of the route in either direction were rated low in maneuverability.
Congestion was rated low on 52.5 percent of the route in the inbound direction and 29.4 percent in the outbound direction, and moderate on 34.6 percent inbound and 70.6 percent outbound. It was rated high on 13.0 percent of the route in the inbound direction, but there were no segments of the route in the outbound direction where it was rated high.
The evaluation of Route 73 is summarized in Table 14.
TABLE 14
Summary of Route 73 Evaluation
Direction |
Time Period |
Service Frequency |
Trip Length |
Concentration of Demand |
Distribution of Demand |
Roadway Geometry |
Traffic Congestion |
|---|---|---|---|---|---|---|---|
Inbound |
6:45 AM – 9:30 AM |
◒ Medium Candidate |
○ Weak Candidate |
◒ Medium Candidate |
○ Weak Candidate |
● Strong Candidate |
● Strong Candidate |
Outbound |
3:33 PM – 7:20 PM |
◒ Medium Candidate |
○ Weak Candidate |
○ Weak Candidate |
○ Weak Candidate |
● Strong Candidate |
◒ Medium Candidate |
● = strong candidate, ◒ = medium candidate, ○ = weak candidate
The entire Route 77 corridor was studied. It runs between Arlington Heights and Harvard Station via Massachusetts Avenue.
The time spans analyzed for this route were 6:00 to 8:45 AM for inbound departures and 3:02 to 7:26 PM for outbound departures. The average headways during these time spans were 7.86 minutes inbound and 7.76 minutes outbound.
The average inbound passenger trip length was 2.01 miles, with 42.7 percent of passenger trips longer than two miles, and 2.1 percent longer than five miles. The average outbound passenger trip length was 1.87 miles, with 39.9 percent of passenger trips longer than two miles, and 1.1 percent longer than five miles.
About 59 percent of the inbound passenger demand was concentrated within 25 percent of stops, as was about 57 percent of the outbound demand. In both directions ridership was heavily concentrated at Harvard Square, with remaining high demand stops distributed fairly evenly along the route.
A high level of maneuverability was rated high on 53.4 percent of the route in the inbound direction and 50.6 percent in the outbound direction, and moderate on 46.6 percent in the inbound direction and 49.4 percent in the outbound direction. No segments of the route in either direction were rated low in maneuverability.
Congestion was rated low on 2.2 percent of the route in the inbound direction and 29.4 percent of the route in the outbound direction. Congestion was not rated moderate on any segments of the route in the inbound direction, but was rated moderate on 55.7 percent outbound, and high on 97.8 percent inbound and 42.2 percent outbound.
The evaluation of Route 77 is summarized in Table 15.
TABLE 15
Summary of Route 77 Evaluation
Direction |
Time Period |
Service Frequency |
Trip Length |
Concentration of Demand |
Distribution of Demand |
Roadway Geometry |
Traffic Congestion |
|---|---|---|---|---|---|---|---|
Inbound |
6:00 AM – 8:45 AM |
○ Weak Candidate |
○ Weak Candidate |
○ Weak Candidate |
◒ Medium Candidate |
● Strong Candidate |
○ Weak Candidate |
Outbound |
3:02 PM – 7:26 PM |
○ Weak Candidate |
○ Weak Candidate |
○ Weak Candidate |
◒ Medium Candidate |
● Strong Candidate |
○ Weak Candidate |
● = strong candidate, ◒ = medium candidate, ○ = weak candidate
The shared portion of the Route 104/109 corridor, between Broadway at Ferry Street in Malden and Sullivan Square Station, was studied.
The time spans analyzed for this corridor were 5:47 to 8:36 AM for inbound departures and 4:00 to 7:00 PM for outbound departures. The average combined headways during these time spans were 6.76 minutes inbound and 7.20 minutes outbound.
The average inbound passenger trip length was 1.20 miles, with 25.3 percent of passenger trips longer than two miles and no trips longer than five miles. The average outbound passenger trip length was 1.08 miles, with 21.1 percent of passenger trips longer than two miles and no trips longer than five miles.
About 77 percent of the inbound passenger demand was concentrated within 25 percent of stops, as was about 74 percent of the outbound demand. However, ridership in both directions was heavily concentrated at Sullivan Square, with no high-demand stops elsewhere along the corridor.
Maneuverability was rated high on 61.5 percent of the route in the inbound direction and 63.5 percent in the outbound direction, and moderate on 38.5 percent inbound and 36.5 percent outbound. No segments of the route in either direction were rated low in maneuverability.
No segments of the route in either direction were rated low in congestion. Congestion was rated moderate on 9.7 percent of the route in the inbound direction and 2.7 percent in the outbound direction, and high on 90.3 percent inbound and 97.3 percent outbound.
The evaluation of Route 104/109 corridor is summarized in Table 16.
TABLE 16
Summary of Route 104/109 Corridor Evaluation
Direction |
Time Period |
Service Frequency |
Trip Length |
Concentration of Demand |
Distribution of Demand |
Roadway Geometry |
Traffic Congestion |
|---|---|---|---|---|---|---|---|
Inbound |
5:47 AM – 8:36 AM |
◒ Medium Candidate |
○ Weak Candidate |
● Strong Candidate |
○ Weak Candidate |
● Strong Candidate |
○ Weak Candidate |
Outbound |
4:00 PM – 7:00 PM |
○ Weak Candidate |
○ Weak Candidate |
◒ Medium Candidate |
○ Weak Candidate |
● Strong Candidate |
○ Weak Candidate |
● = strong candidate, ◒ = medium candidate, ○ = weak candidate
The portion of the Route 111 between Haymarket Station and Woodlawn was studied.
The time spans analyzed for this route were 5:02 to 9:29 AM for inbound departures and 3:01 to 7:00 PM for outbound departures. The average headway during these time spans was 3.87 minutes inbound and 4.05 minutes outbound.
The average inbound passenger trip length was 1.87 miles, with 31.3 percent of passenger trips longer than two miles and 7.5 percent longer than five miles. The average outbound passenger trip length was 1.90 miles, with 33.2 percent of passenger trips longer than two miles and 6.4 percent longer than five miles.
About 77 percent of the inbound passenger demand was concentrated within 25 percent of stops, as was about 74 percent of the outbound demand. However, ridership in both directions was heavily concentrated at Haymarket, with only a few high-demand stops elsewhere along the route.
Maneuverability was rated high on 86.9 percent of the route in the inbound direction and 75.4 percent in the outbound direction, and moderate on 13.1 percent in the inbound direction and 24.6 percent in the outbound direction. No segments of the route in either direction were rated low in maneuverability.
Congestion was rated low found on 27.1 percent of the route in the inbound direction and 40.0 percent in the outbound direction, moderate on 10.3 percent inbound and 49.3 percent outbound, and high on 62.7 percent inbound and 10.7 percent outbound.
The evaluation of Route 111 is summarized in Table 17.
TABLE 17
Summary of Route 111 Evaluation
Direction |
Time Period |
Service Frequency |
Trip Length |
Concentration of Demand |
Distribution of Demand |
Roadway Geometry |
Traffic Congestion |
|---|---|---|---|---|---|---|---|
Inbound |
5:02 AM – 9:29 AM |
● Strong Candidate |
○ Weak Candidate |
● Strong Candidate |
○ Weak Candidate |
● Strong Candidate |
○ Weak Candidate |
Outbound |
3:01 PM – 7:00 PM |
● Strong Candidate |
○ Weak Candidate |
◒ Medium Candidate |
○ Weak Candidate |
● Strong Candidate |
◒ Medium Candidate |
● = strong candidate, ◒ = medium candidate, ○ = weak candidate
The shared portion of the Route 116/117 corridor, between Broadway at Central Street in Revere and Maverick Station, was studied.
The time spans analyzed for this corridor were 5:36 to 9:01 AM for inbound departures and 4:00 to 6:30 PM for outbound departures. The average combined headways during these time spans were 5.54 minutes inbound and 7.14 minutes outbound.
The average inbound passenger trip length was 1.47 miles, with 24.0 percent of passenger trips longer than two miles. The average outbound passenger trip length was 1.37 miles, with 21.0 percent of passenger trips longer than two miles. No trips in either direction were longer than five miles.
About 64 percent of the inbound passenger demand was concentrated within 25 percent of stops, as was about 67 percent of the outbound demand. However, ridership in both directions was heavily concentrated at Maverick Station, with only a few high-demand stops elsewhere along the corridor.
Maneuverability was rated high found on 21.6 percent of the in the inbound direction and 17.4 percent in the outbound direction, and moderate on 78.4 percent in the inbound direction and 82.6 percent in the outbound direction. No segments of the route in either direction were rated low in maneuverability.
Congestion levels on the corridor differed substantially by direction. A low level of congestion was found on 73.6 percent of the route in the inbound direction, but was not found on any segments in the outbound direction. Congestion was not rated moderate on any segments inbound but was rated moderate on 86.3 percent outbound, and high on 26.4 percent inbound and 13.7 percent outbound.
The evaluation of Route 116/117 corridor is summarized in Table 18.
TABLE 18
Summary of Route 116/117 Corridor Evaluation
Direction |
Time Period |
Service Frequency |
Trip Length |
Concentration of Demand |
Distribution of Demand |
Roadway Geometry |
Traffic Congestion |
|---|---|---|---|---|---|---|---|
Inbound |
5:36 AM – 9:01 AM |
◒ Medium Candidate |
○ Weak Candidate |
○ Weak Candidate |
◒ Medium Candidate |
◒ Medium Candidate |
○ Weak Candidate |
Outbound |
4:00 PM – 6:30 PM |
○ Weak Candidate |
○ Weak Candidate |
◒ Medium Candidate |
◒ Medium Candidate |
◒ Medium Candidate |
◒ Medium Candidate |
● = strong candidate, ◒ = medium candidate, ○ = weak candidate
After the evaluation criteria were applied, the routes and corridors were divided into the following three categories:
None of the MBTA routes and corridors evaluated in this study had all of the attributes needed to justify limited-stop bus service.
Each routes and corridor in this tier was rated as a strong or medium candidate based on three of the limited-stop criteria: passenger trip lengths, demand concentration, and demand distribution. Each was rated as a medium or weak candidate based on service frequency, roadway geometry, or traffic congestion, all of which might be raised to higher standards by applying additional resources. For example, if the MBTA budget allowed limited-stop trips to be run in addition to, rather than in place of, local-service trips, present headways would be a less important factor in the rating. For routes with poor roadway geometry and/or a high level of congestion, potential running-time savings could be improved through the use of dedicated bus lanes (lanes that are used exclusively by buses), queue jumps, or transit signal priority.
As shown in Table 19, the Route 70/70A corridor is the only Tier 2 route or corridor because it is the only MBTA route or corridor that qualified as a strong candidate based on existing passenger trip lengths. To implement service on the Route 70/70A corridor, limited-stop trips would need to be run in addition to, rather than in place of, local-service trips because of the low frequency of service. Because the number of local-service trips would not be reduced, there would be no increase in passenger access time, wait time, and egress time for passengers who would continue to use local service. This means that although the Route 70/70A corridor was a weak-to-medium candidate based on its concentration of demand, that factor is less important than other factors in the corridor’s potential for successful limited-stop service. In order to achieve maximum levels of efficiency, dedicated bus lanes, queue jumps, or transit signal priority should be explored as options for improving vehicle run times, since there is a high level of traffic congestion along the route.
TABLE 19
Tier 2 Bus Routes and Corridors
Route |
Service Frequency |
Trip Length |
Concentration of Demand |
Distribution of Demand |
Roadway Geometry |
Traffic Congestion |
|---|---|---|---|---|---|---|
70/70A Inbound |
○ Weak Candidate |
● Strong Candidate |
○ Weak Candidate |
◒ Medium Candidate |
● Strong Candidate |
○ Weak Candidate |
70/70A Outbound |
○ Weak Candidate |
● Strong Candidate |
◒ Medium Candidate |
◒ Medium Candidate |
● Strong Candidate |
○ Weak Candidate |
● = strong candidate, ◒ = medium candidate, ○ = weak candidate
Except for the Route 70/70A corridor, the MBTA routes and corridors evaluated in this study should not be considered for limited-stop bus service. Operational or roadway design changes could not correct the characteristics that make them unsuitable for such service; the average passenger trip lengths on these routes are too short to allow onboard travel-time savings from limited-stop service to offset the increased access, egress, and wait times. One of the major findings from the literature review was that for a corridor to be recommended for limited-stop service, at least 10 percent of passenger trips should be longer than five miles, but the entire length of many of the MBTA routes evaluated was less than five miles.
On a majority of the MBTA routes and corridors, the distribution of highly concentrated demand points is inconsistent with appropriate distribution of stops for limited-stop service. Many of the routes and corridors are rapid transit feeders, with high-demand stops at one end and low levels of demand along the rest of the corridor. A summary of the evaluation of these routes and corridors is provided in Table 20.
TABLE 20
Tier 3 Routes and Corridors
| Route |
Service Frequency |
Trip Length |
Concentration of Demand |
Distribution of Demand |
Roadway Geometry |
Traffic Congestion |
|---|---|---|---|---|---|---|
15 Inbound |
◒ Medium Candidate |
○ Weak Candidate |
○ Weak Candidate |
◒ Medium Candidate |
◒ Medium Candidate |
○ Weak Candidate |
15 Outbound |
○ Weak Candidate |
○ Weak Candidate |
○ Weak Candidate |
◒ Medium Candidate |
◒ Medium Candidate |
○ Weak Candidate |
22 Inbound |
○ Weak Candidate |
○ Weak Candidate |
○ Weak Candidate |
◒ Medium Candidate |
● Strong Candidate |
○ Weak Candidate |
22 Outbound |
○ Weak Candidate |
○ Weak Candidate |
○ Weak Candidate |
◒ Medium Candidate |
● Strong Candidate |
○ Weak Candidate |
23 Inbound |
◒ Medium Candidate |
○ Weak Candidate |
○ Weak Candidate |
◒ Medium Candidate |
● Strong Candidate |
○ Weak Candidate |
23 Outbound |
○ Weak Candidate |
○ Weak Candidate |
○ Weak Candidate |
◒ Medium Candidate |
● Strong Candidate |
○ Weak Candidate |
28 Inbound |
◒ Medium Candidate |
○ Weak Candidate |
○ Weak Candidate |
○ Weak Candidate |
● Strong Candidate |
○ Weak Candidate |
28 Outbound |
○ Weak Candidate |
○ Weak Candidate |
○ Weak Candidate |
○ Weak Candidate |
● Strong Candidate |
○ Weak Candidate |
31 Inbound |
● Strong Candidate |
○ Weak Candidate |
◒ Medium Candidate |
○ Weak Candidate |
◒ Medium Candidate |
◒ Medium Candidate |
31 Outbound |
● Strong Candidate |
○ Weak Candidate |
◒ Medium Candidate |
○ Weak Candidate |
◒ Medium Candidate |
○ Weak Candidate |
32 Inbound |
● Strong Candidate |
○ Weak Candidate |
◒ Medium Candidate |
○ Weak Candidate |
● Strong Candidate |
○ Weak Candidate |
32 Outbound |
● Strong Candidate |
○ Weak Candidate |
◒ Medium Candidate |
○ Weak Candidate |
● Strong Candidate |
◒ Medium Candidate |
34/34E/40 Inbound |
● Strong Candidate |
○ Weak Candidate |
◒ Medium Candidate |
○ Weak Candidate |
◒ Medium Candidate |
○ Weak Candidate |
34/34E/40 Outbound |
◒ Medium Candidate |
○ Weak Candidate |
◒ Medium Candidate |
○ Weak Candidate |
◒ Medium Candidate |
○ Weak Candidate |
39 Inbound |
◒ Medium Candidate |
◒ Medium Candidate |
○ Weak Candidate |
◒ Medium Candidate |
◒ Medium Candidate |
○ Weak Candidate |
39 Outbound |
◒ Medium Candidate |
○ Weak Candidate |
○ Weak Candidate |
◒ Medium Candidate |
◒ Medium Candidate |
○ Weak Candidate |
57/57A Inbound |
◒ Medium Candidate |
○ Weak Candidate |
◒ Medium Candidate |
○ Weak Candidate |
◒ Medium Candidate |
○ Weak Candidate |
57/57A Outbound |
◒ Medium Candidate |
○ Weak Candidate |
○ Weak Candidate |
○ Weak Candidate |
◒ Medium Candidate |
○ Weak Candidate |
66 Inbound |
○ Weak Candidate |
○ Weak Candidate |
○ Weak Candidate |
● Strong Candidate |
● Strong Candidate |
○ Weak Candidate |
66 Outbound |
○ Weak Candidate |
○ Weak Candidate |
○ Weak Candidate |
● Strong Candidate |
● Strong Candidate |
○ Weak Candidate |
71 Inbound |
◒ Medium Candidate |
○ Weak Candidate |
◒ Medium Candidate |
○ Weak Candidate |
● Strong Candidate |
● Strong Candidate |
71 Outbound |
○ Weak Candidate |
○ Weak Candidate |
◒ Medium Candidate |
○ Weak Candidate |
● Strong Candidate |
● Strong Candidate |
73 Inbound |
◒ Medium Candidate |
○ Weak Candidate |
◒ Medium Candidate |
○ Weak Candidate |
● Strong Candidate |
● Strong Candidate |
73 Outbound |
◒ Medium Candidate |
○ Weak Candidate |
○ Weak Candidate |
○ Weak Candidate |
● Strong Candidate |
◒ Medium Candidate |
77 Inbound |
○ Weak Candidate |
○ Weak Candidate |
○ Weak Candidate |
◒ Medium Candidate |
● Strong Candidate |
○ Weak Candidate |
77 Outbound |
○ Weak Candidate |
○ Weak Candidate |
○ Weak Candidate |
◒ Medium Candidate |
● Strong Candidate |
○ Weak Candidate |
104/109 Inbound |
◒ Medium Candidate |
○ Weak Candidate |
● Strong Candidate |
○ Weak Candidate |
● Strong Candidate |
○ Weak Candidate |
104/109 Outbound |
○ Weak Candidate |
○ Weak Candidate |
◒ Medium Candidate |
○ Weak Candidate |
● Strong Candidate |
○ Weak Candidate |
111 Inbound |
● Strong Candidate |
○ Weak Candidate |
● Strong Candidate |
○ Weak Candidate |
● Strong Candidate |
○ Weak Candidate |
111 Outbound |
● Strong Candidate |
○ Weak Candidate |
◒ Medium Candidate |
○ Weak Candidate |
● Strong Candidate |
◒ Medium Candidate |
116/117 Inbound |
◒ Medium Candidate |
○ Weak Candidate |
○ Weak Candidate |
◒ Medium Candidate |
◒ Medium Candidate |
○ Weak Candidate |
116/117 Outbound |
○ Weak Candidate |
○ Weak Candidate |
◒ Medium Candidate |
◒ Medium Candidate |
◒ Medium Candidate |
◒ Medium Candidate |
● = strong candidate, ◒ = medium candidate, ○ = weak candidate
None of the MBTA routes and corridors that were evaluated in this study had all the attributes necessary for recommending the implementation of limited-stop bus service at this time. The only route or corridor that was found to have potential for limited-stop service was the Route 70/70A corridor. In this corridor, the trip lengths, distribution of demand, and roadway geometry were all favorable for limited-stop service, but such service would also require increasing the service frequency and providing dedicated bus lanes, queue jumps, and/or transit signal priority.
None of the other bus routes and corridors evaluated in this study should be recommended for limited-stop service because the passenger trips on those routes are too short for onboard time savings to offset the potential increases in access time, wait time, and egress time, and/or the distribution of highly concentrated demand points is not consistent with the appropriate distribution of stops for limited-stop service.
NH/nh
This is a set of appendices that uses bar graphs to display the data that were used to evaluate the potential for limited-stop bus service of selected MBTA bus routes and corridors. Each appendix provides data in the form of bar graphs for an individual MBTA bus route or corridor. Only the title of each figure can be read by a screen reader, and the bar graphs cannot be made accessible. If you have any questions, please contact the Central Transportation Planning Staff, at 857-702-3700, and ask for the Transit Service Planning Group.
1 Nicholas Hart, Boston Region Metropolitan Planning Organization staff, memorandum to the Boston Region Metropolitan Planning Organization, July 9, 2015, “Limited-Stop Study, Phase 1: Review of Limited-Stop Bus Service.”
2 Nicholas Hart, Boston Region Metropolitan Planning Organization staff, memorandum to the Boston Region Metropolitan Planning Organization, July 9, 2015, “Limited-Stop Study, Phase 2: Methodology for Evaluating Limited-Stop Bus Service Potential.”
3 M. Sholler, “Evaluating Express Bus Service,”master's thesis, Massachusetts Institute of Technology, 2003.
4 Jason B. Gordon, “Automated Inference of Full Passenger Journeys Using Fare-Transaction and Vehicle-Location Data,” master’s thesis, Massachusetts Institute of Technology, 2012.
5 Nicholas Hart, Boston Region Metropolitan Planning Organization staff, memorandum to the Boston Region Metropolitan Planning Organization, July 9, 2015, “Limited-Stop Study, Phase 2: Methodology for Evaluating Limited-Stop Bus Service Potential.”
6 Trackless trolley Route 71 overlaps trackless trolley Route 73 between Mt. Auburn Street and Belmont Street to Harvard Station.
7 Trackless trolley Route 73 overlaps trackless trolley Route 71 between Mt. Auburn Street and Belmont Street to Harvard Station.